Super Bowl ADS Analysis
Power BI
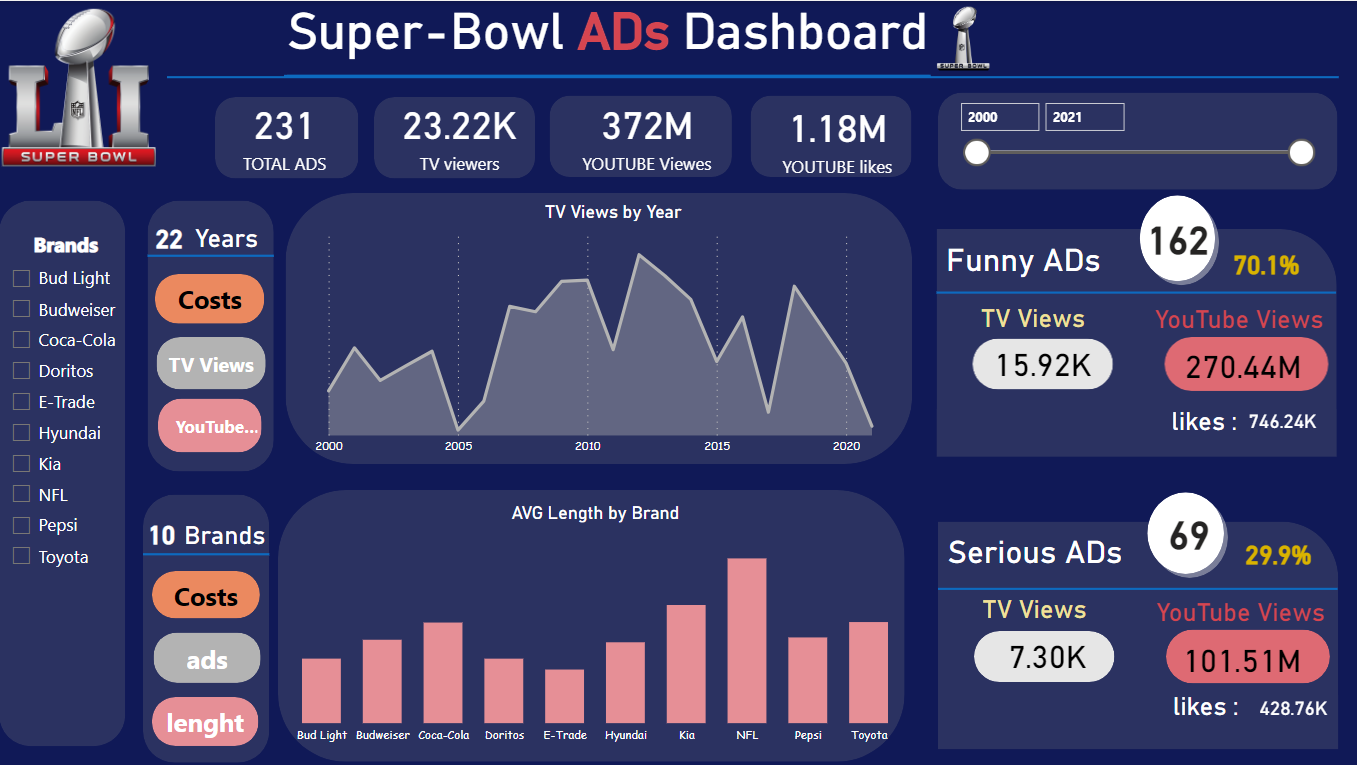
The Super Bowl Ads Analysis Dashboard provides a comprehensive overview and analysis of Super Bowl ads for 10 different brands over a span of 22 years. The dashboard focuses on analyzing series and funny ads and derives descriptive Key Performance Indicators (KPIs) related to the total number of ads, likes, and views on both TV and YouTube platforms.
Fleet Management Analysis
Power BI
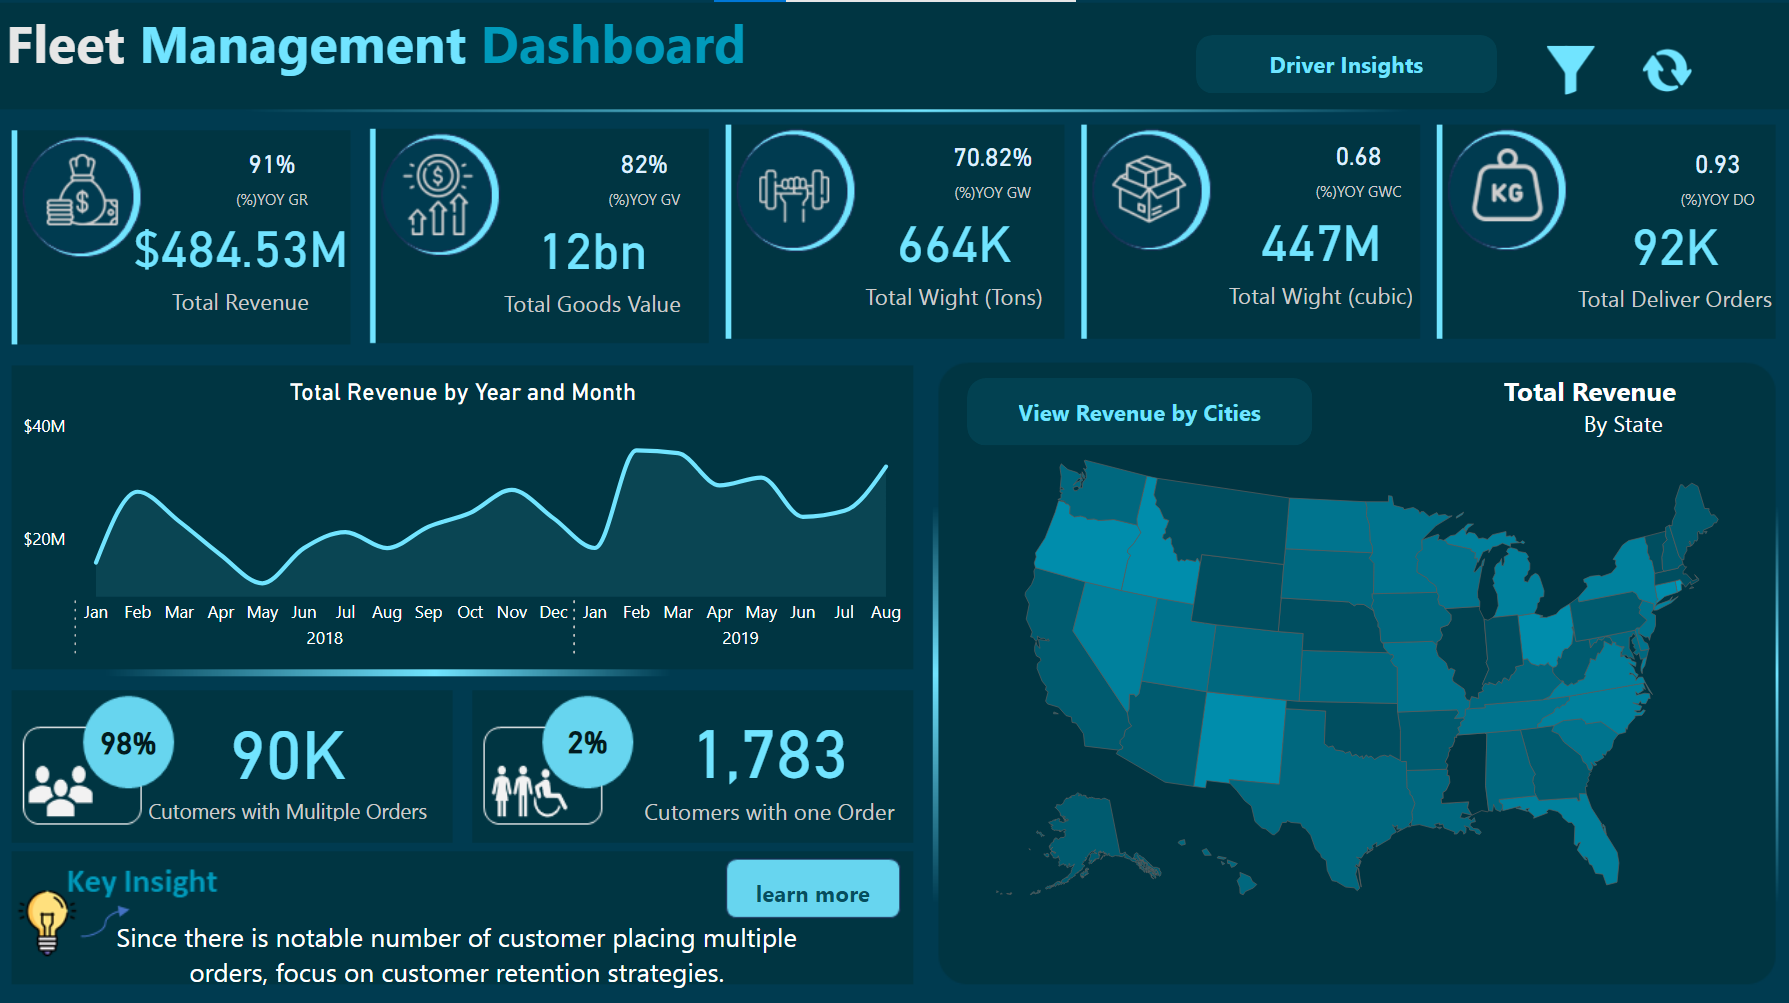
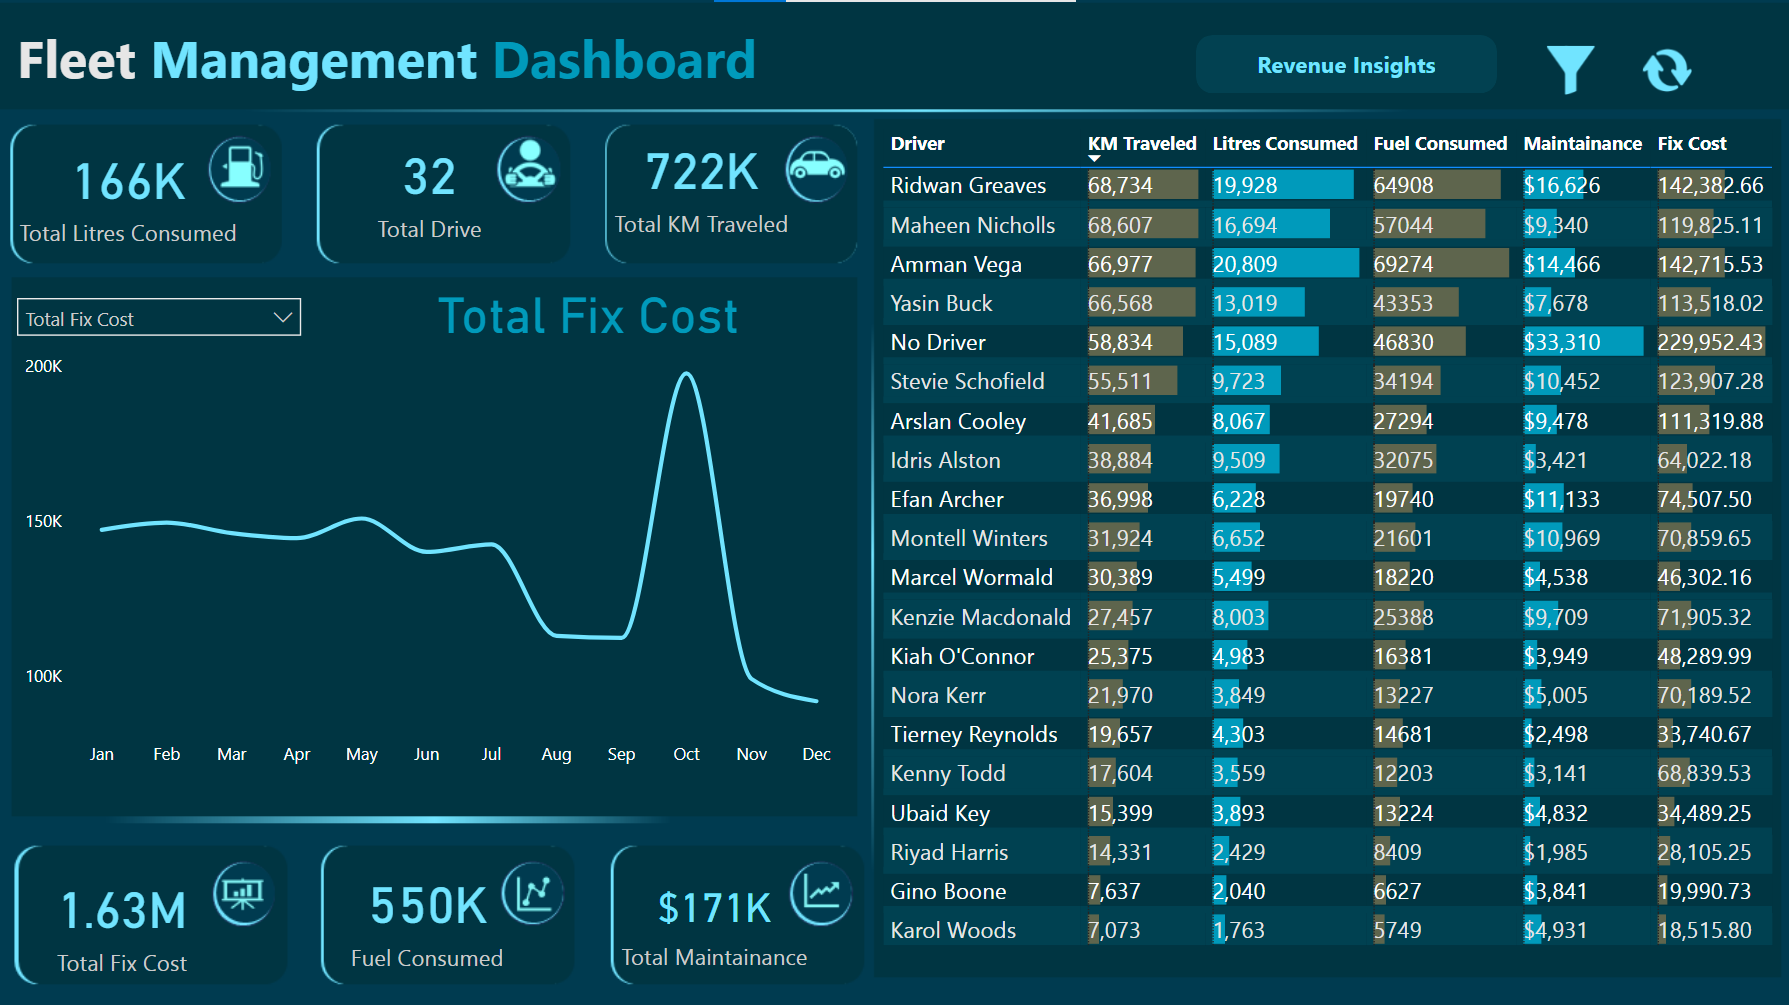
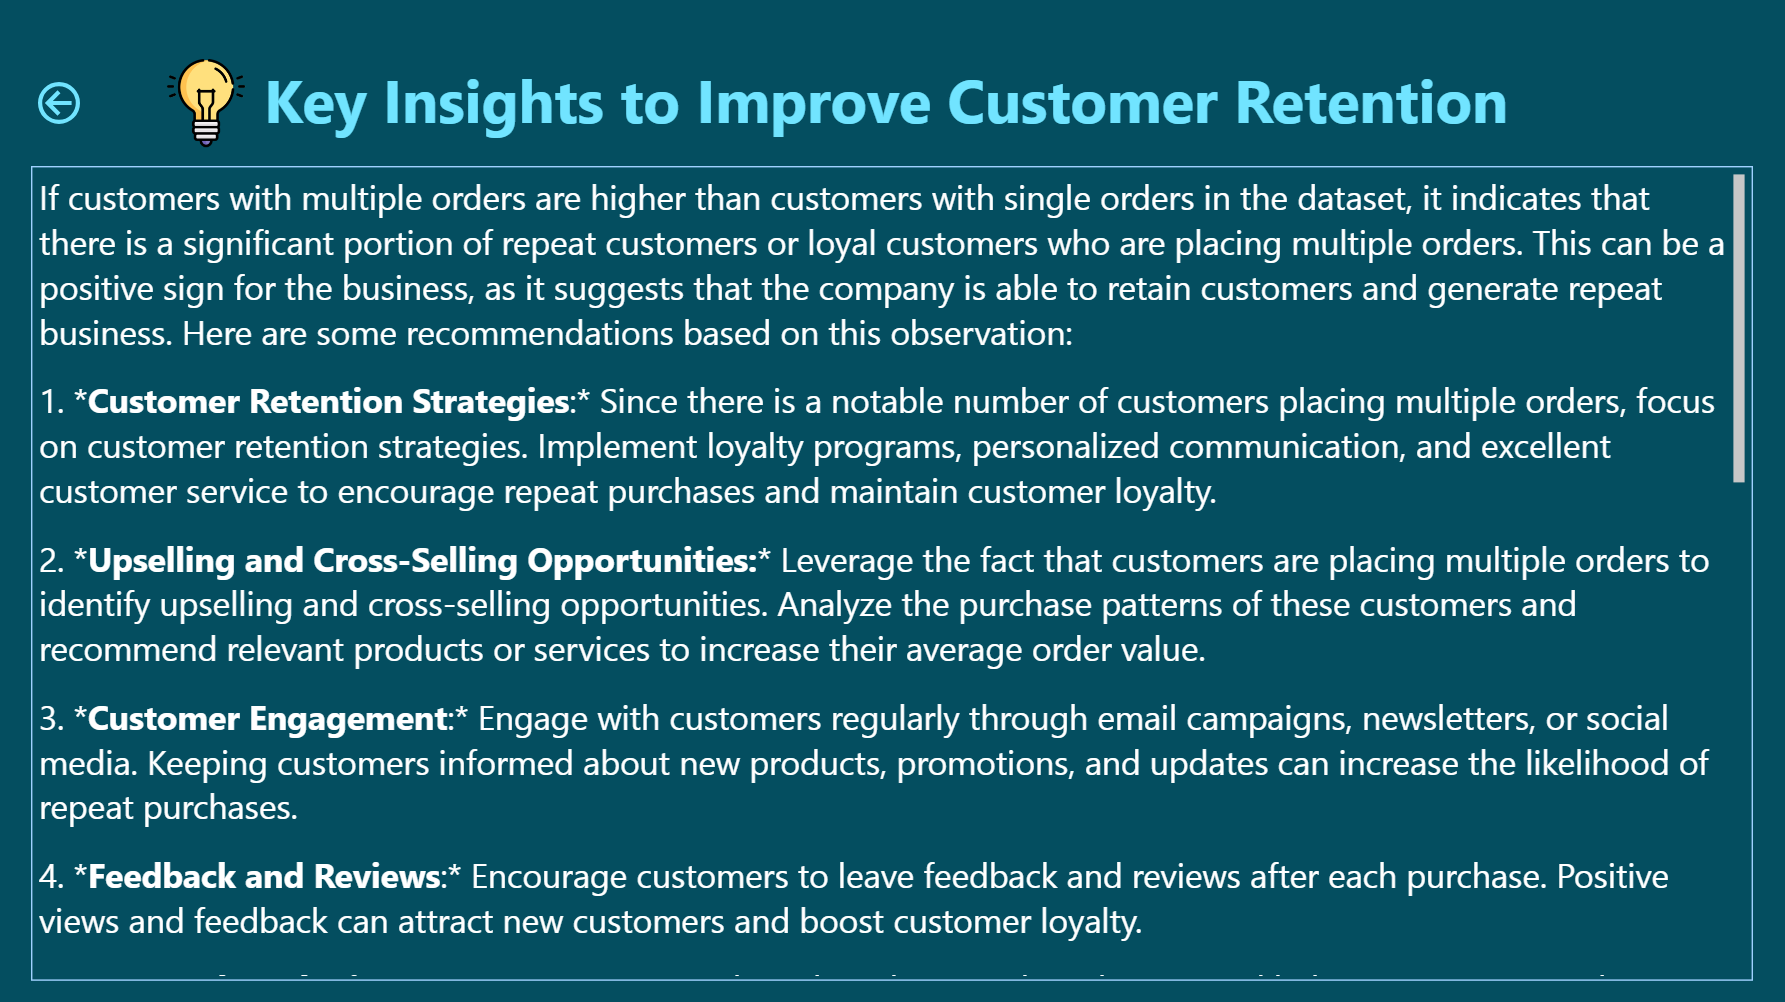
The Fleet Management Dashboard provides a comprehensive overview and analysis of fleet operations. This dashboard tracks key metrics such as fuel consumption, maintenance costs, and driver performance for 32 drivers over a year. It offers insights into total revenue, kilometers traveled, and customer retention, utilizing advanced data visualization techniques to optimize fleet efficiency and drive business growth.
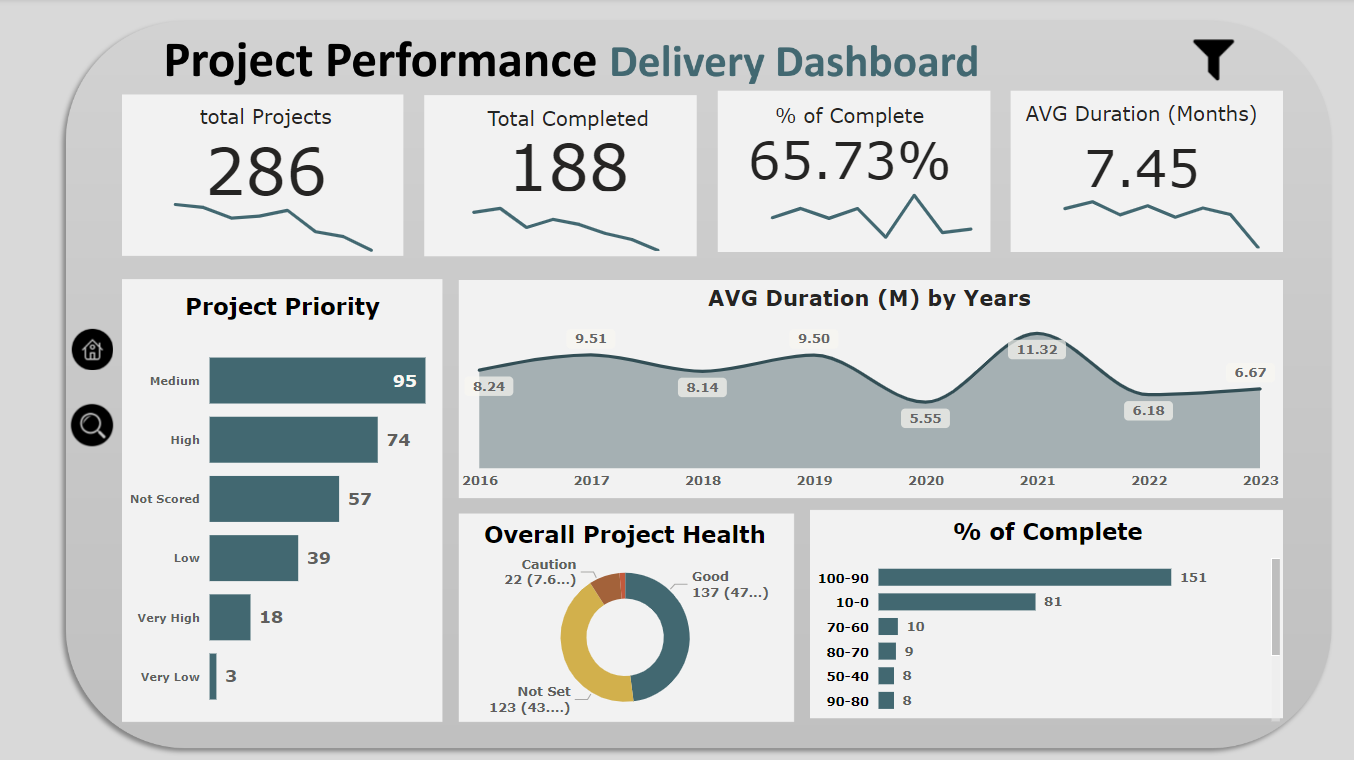
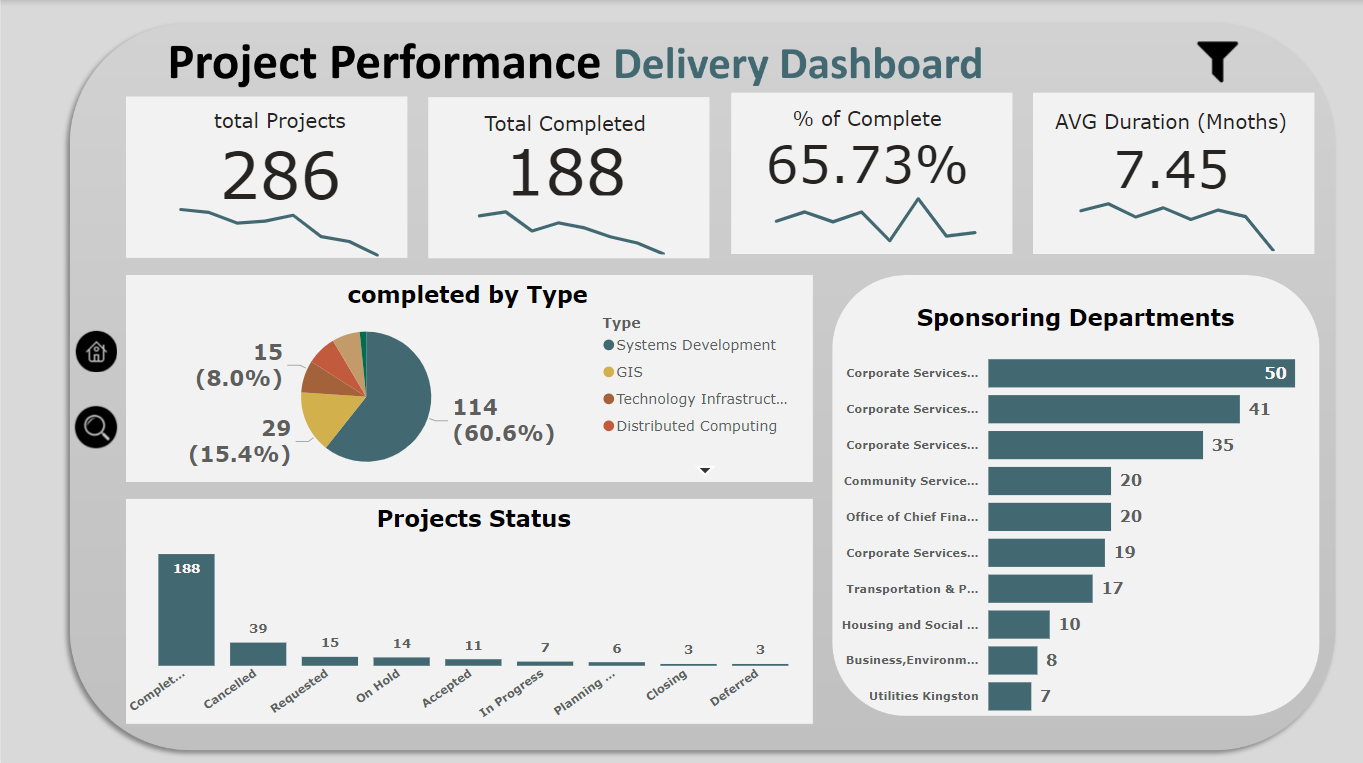
Project Performance Analysis
Power BI
In this project, I demonstrated a comprehensive skill set, including proficiency in Sponsorship Department analysis, adept handling of Project Status evaluations, insightful examination of Completed Trends, skillful consideration of Average Project Duration, effective management of Priority Levels, and nuanced interpretation of Project Completion Categorization. Additionally, I showcased my ability to assess the overall health of the project, ensuring its vitality throughout the execution phase.
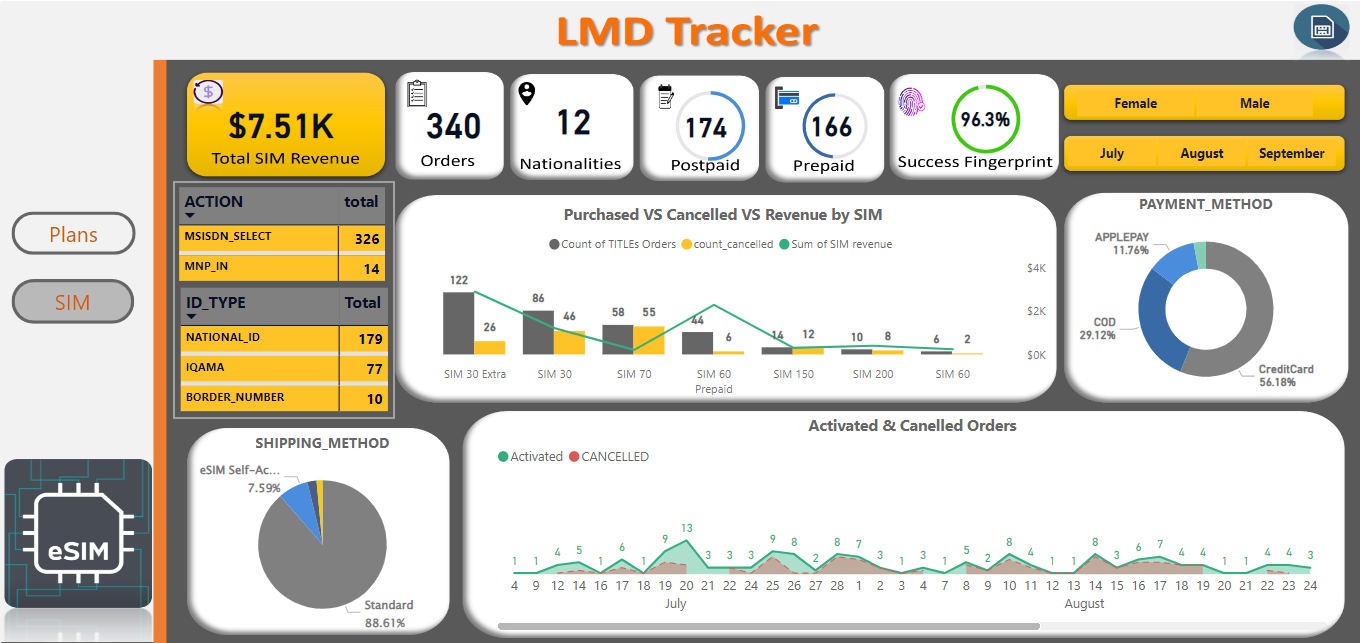
SIM Tracker Analysis
Power BI
The SIM Tracker Dashboard provides businesses with valuable insights into customer subscriptions and SIM card tracking data. By understanding customer demographics, preferences, and purchasing behavior, businesses can optimize their marketing efforts, streamline operations, and drive revenue growth. The dashboard enables businesses to make informed decisions based on real-time data, ensuring a customer-centric approach to subscription and SIM card offerings.
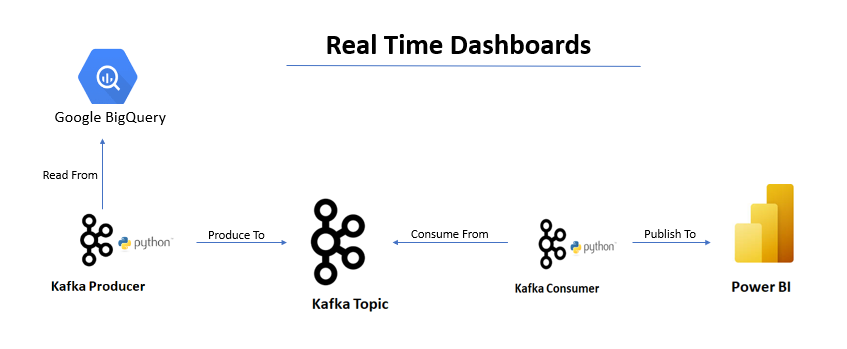
Real-Time Dashboard Analysis
Kafka & Power BI Service & Python & BigQuery
This dashboard leverages the power of Kafka, Power BI Service, Python, and BigQuery to display the top 15 trends in Egypt in real-time. The dashboard seamlessly integrates these technologies to pull data from BigQuery, stream it through Kafka using a Python producer, and consume the streaming data to push it to Power BI Service. This integration allows users to monitor and visualize the latest trends in Egypt as they unfold.
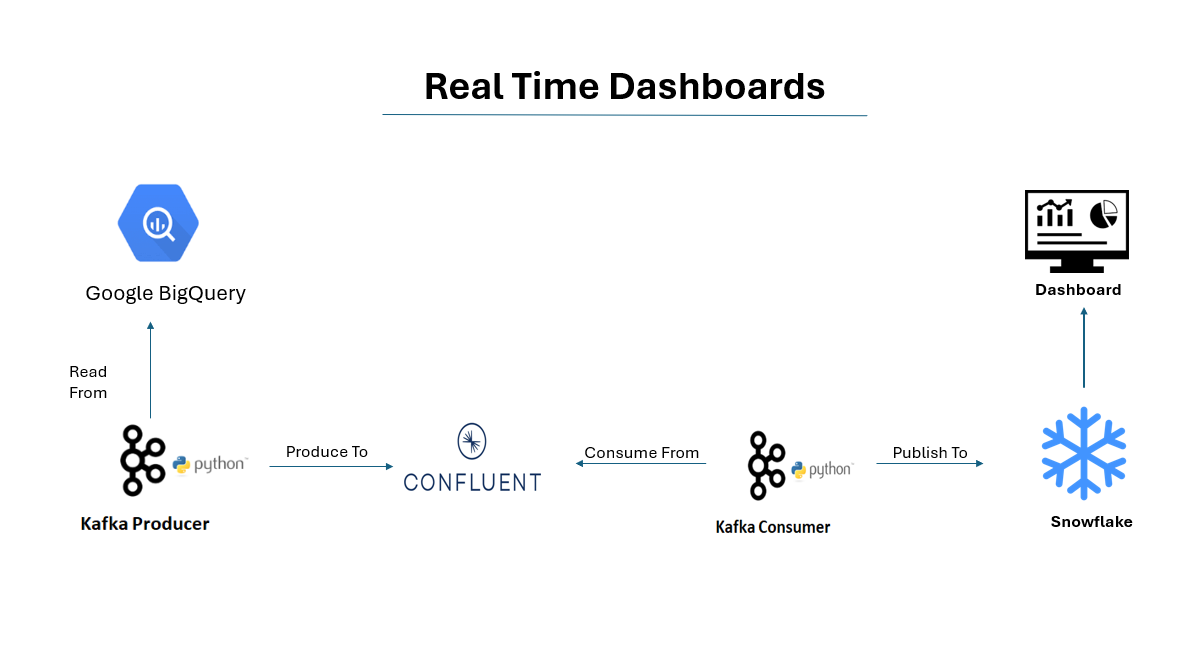
Confluent Kafka, Snowflake, and BigQuery Integration
Confluent Kafka & Snowflake & Python & BigQuery
In this integration case, I leveraged Confluent Kafka to facilitate seamless data transfer from BigQuery to Snowflake using Python, enhancing both storage and analysis efficiency. The successful integration results in the establishment of a Snowflake database, accompanied by a directly linked dashboard for real-time monitoring and analysis
Sales and Profit Analysis
Power BI
This dashboard provides a comprehensive overview and analysis of sales and profit data across various categories, years, regions, shipping modes, states, segments, and products. The dashboard enables users to explore and derive insights regarding the profitability and performance of different aspects of the business.

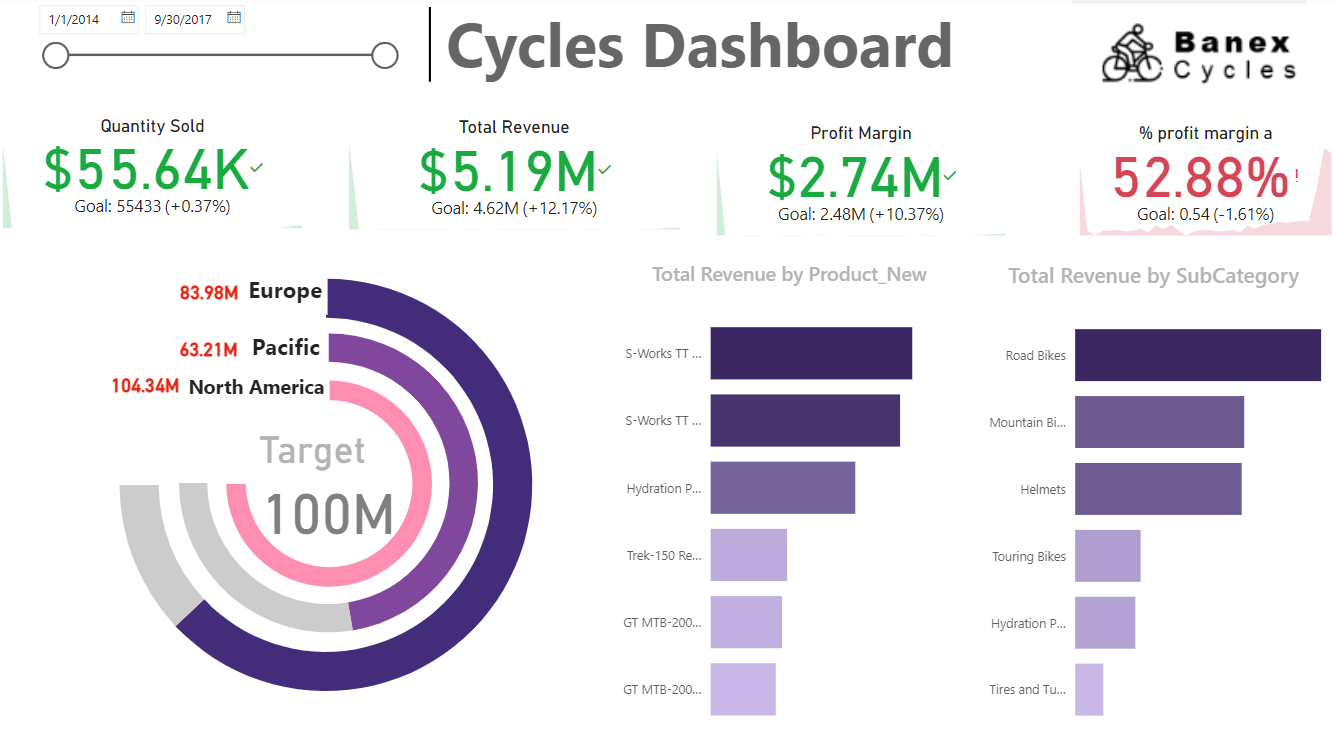
Cycles sales analysis
Power BI
This dashboard provides an in-depth analysis of cycle sales data, focusing on key metrics such as quantity sold, total revenue, profit margin, and profit margin percentage. The dashboard offers insightful charts and visualizations that showcase total revenue by products and subcategories, as well as the actual sales figures for specific regions, including Europe, North America, and the Pacific.
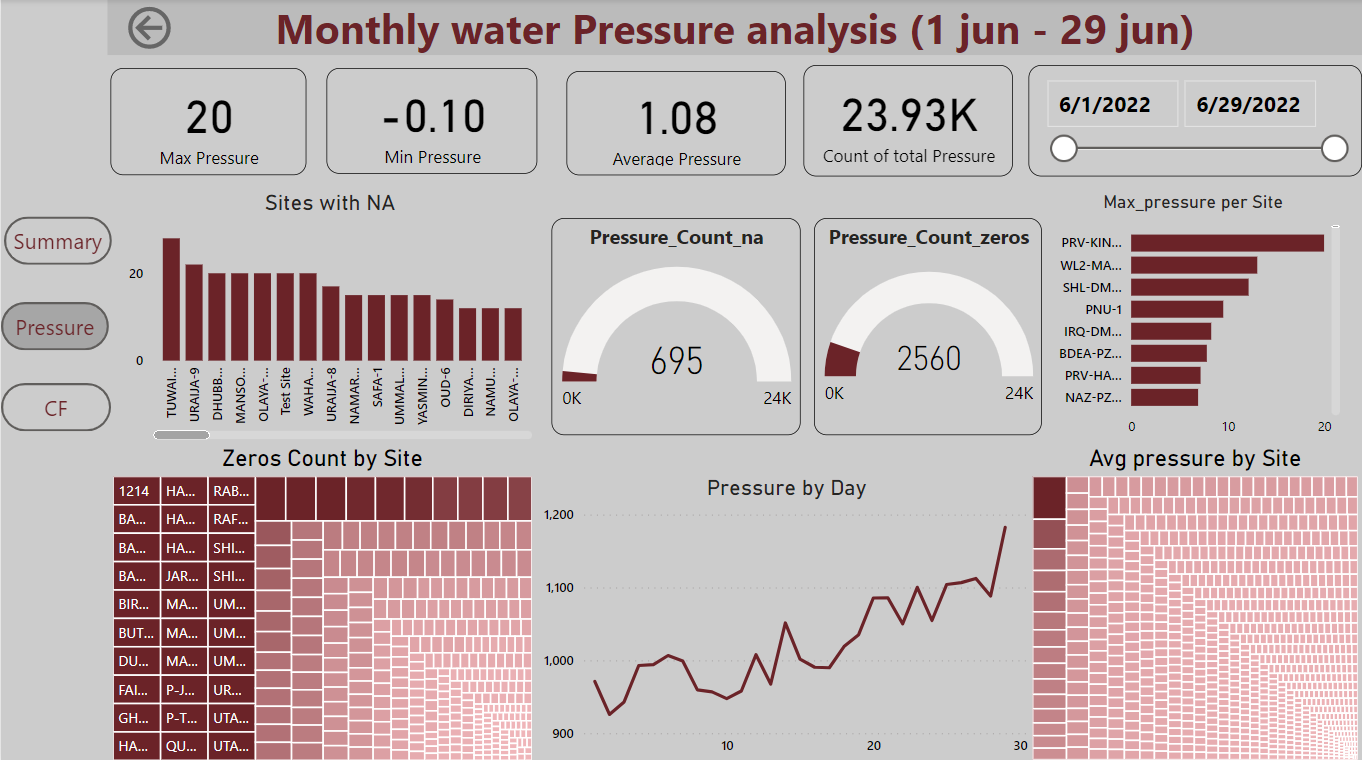
Water Flow Analysis
Power BI
This Dashboard is a comprehensive tool designed to Monitor and analyze water pressure and flow readings for different sites, Identify anomalies, trends, and potential issues related to water infrastructure, Evaluate the performance of each site and identify areas for improvement, Optimize water distribution, and ensure efficient water management.
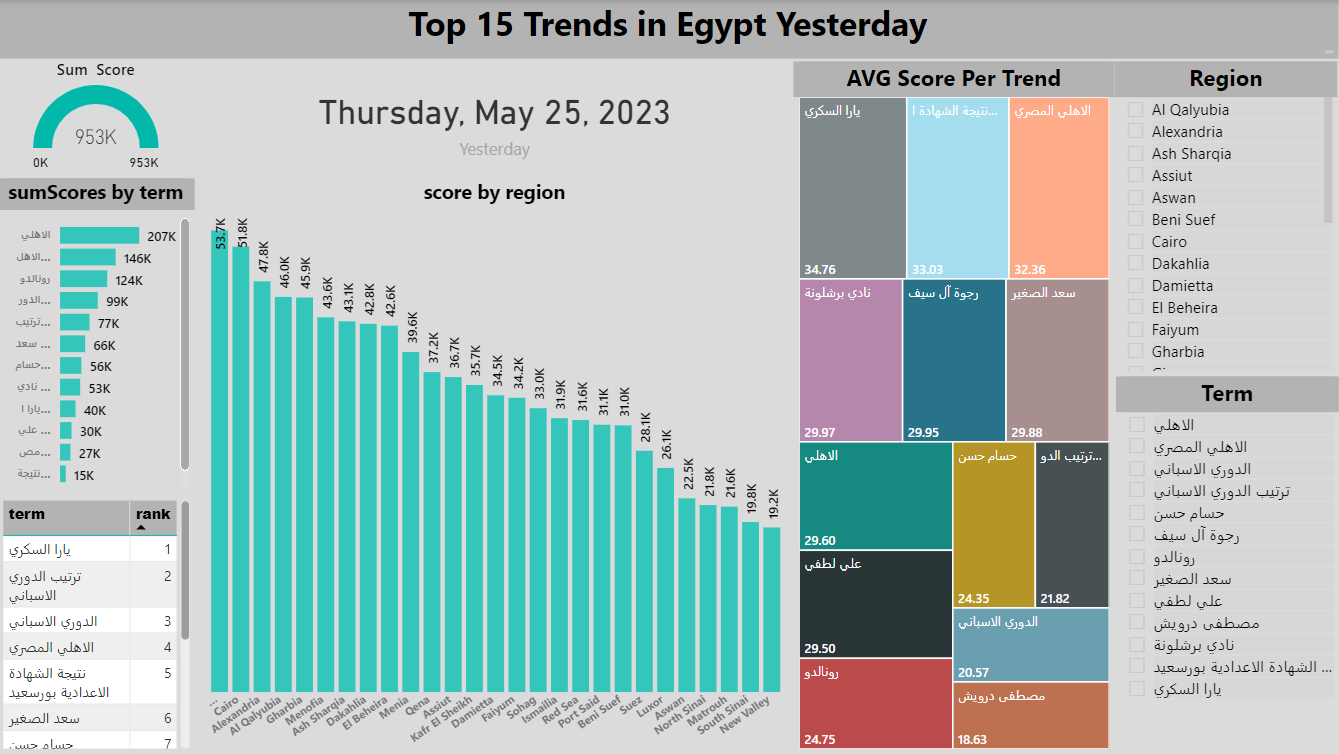
Egypt Google Trends analysis
Power Bi & bigQuery & SQL
The Google Trends Dashboard for Egypt is a dynamic tool that pulls data from Google Trends via BigQuery. It provides valuable insights into the top 15 trends in Egypt over the past 24 hours. The dashboard automatically updates the data, ensuring users have access to the most recent information. Additionally, it allows users to define the ordered trends and scores by region, as well as calculate the sum score for each trend.
< Tableau
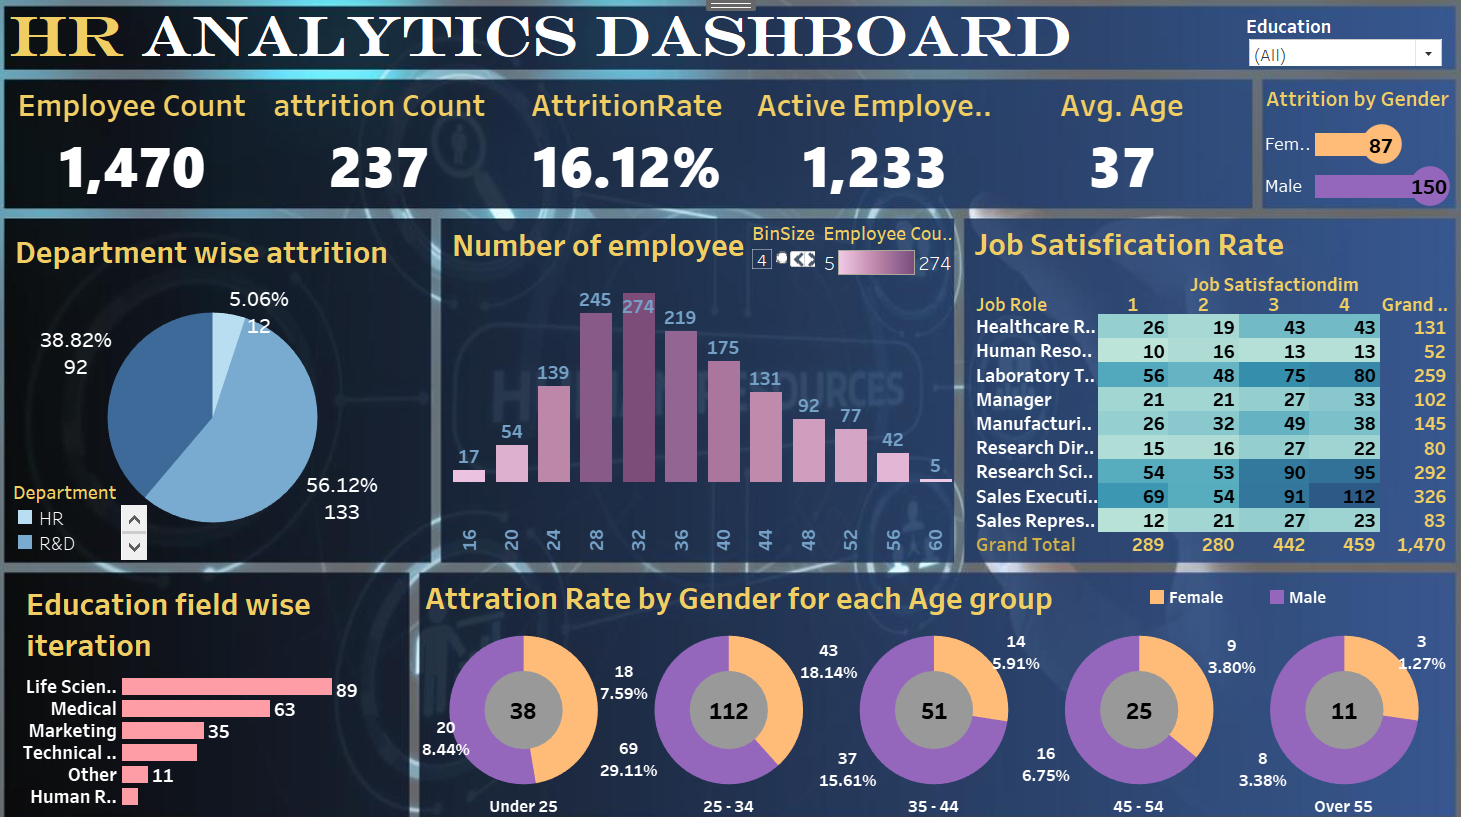
HR Analytics Analysis
Tableau
This dashboard empowers HR professionals and decision-makers to make informed decisions regarding talent management, recruitment, and employee satisfaction. By providing valuable insights into attraction metrics, employee demographics, satisfaction rates, and education field iteration, the dashboard supports data-driven HR strategies and fosters an engaged and productive workforce.
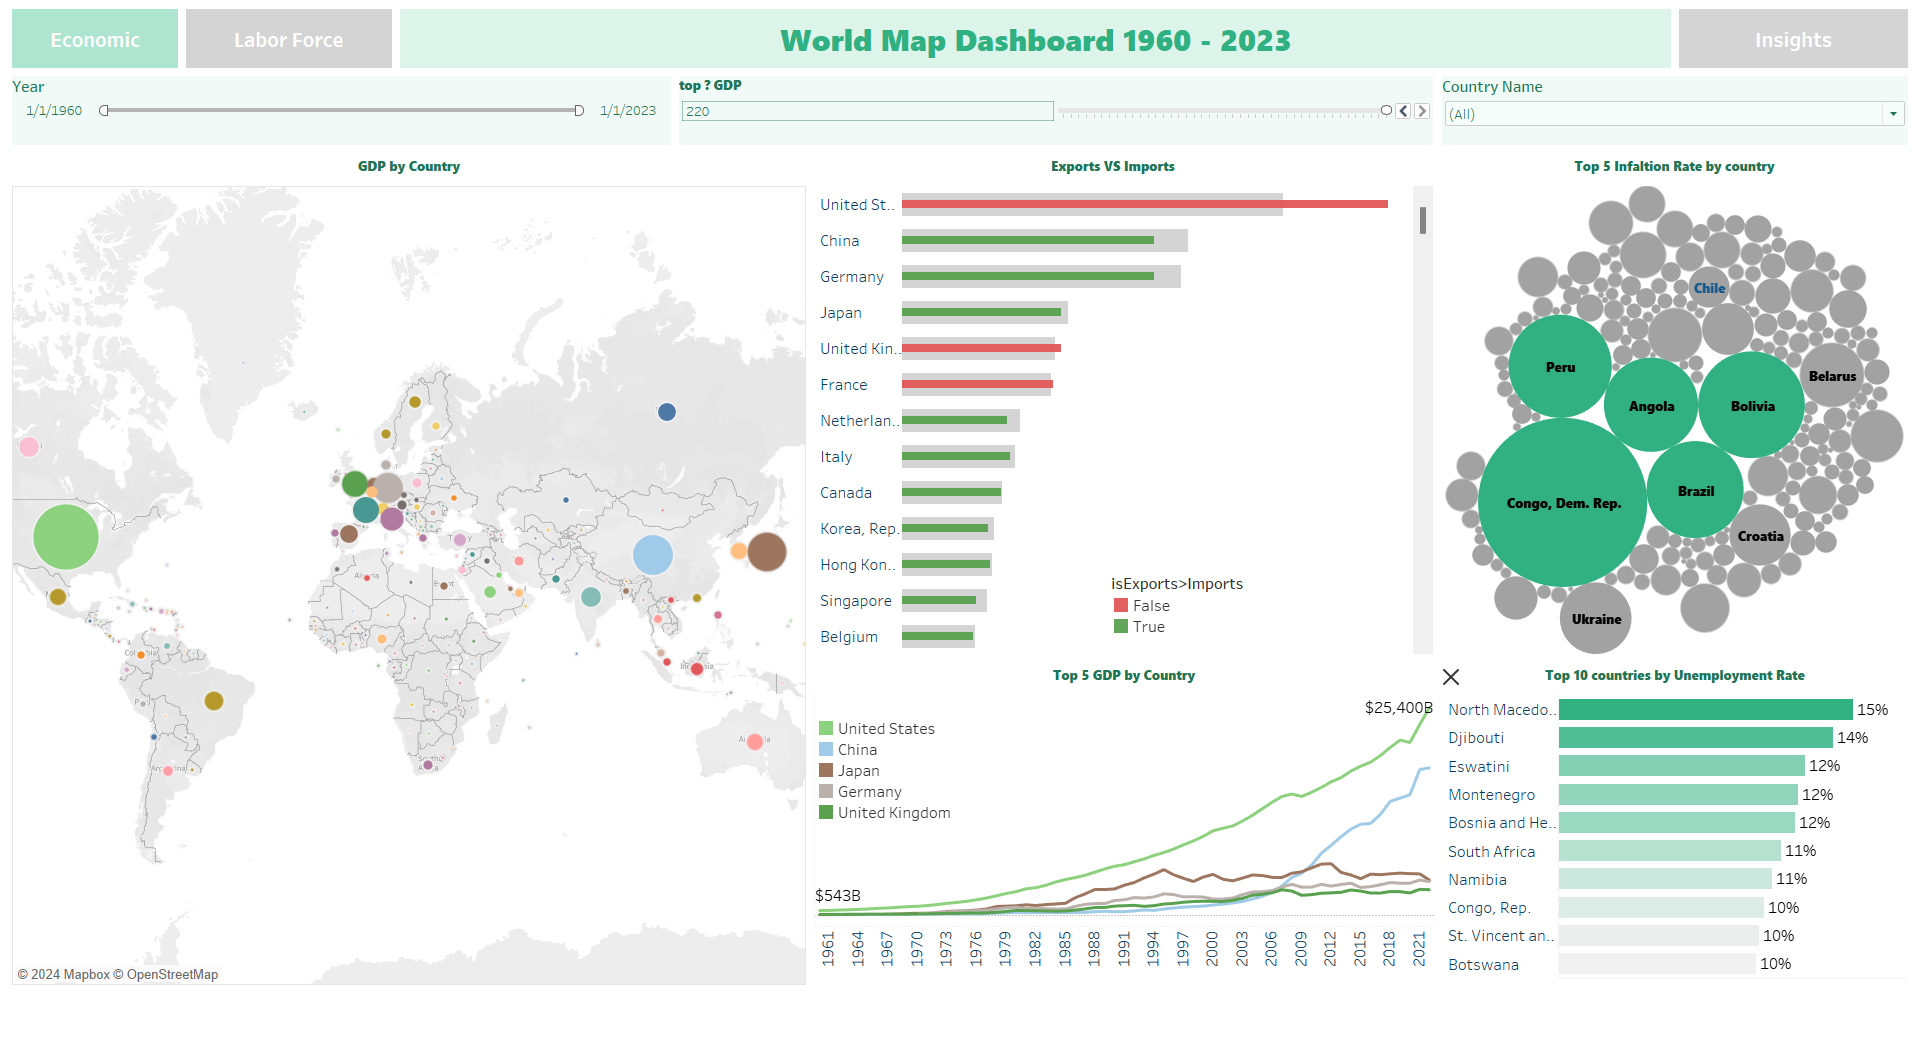
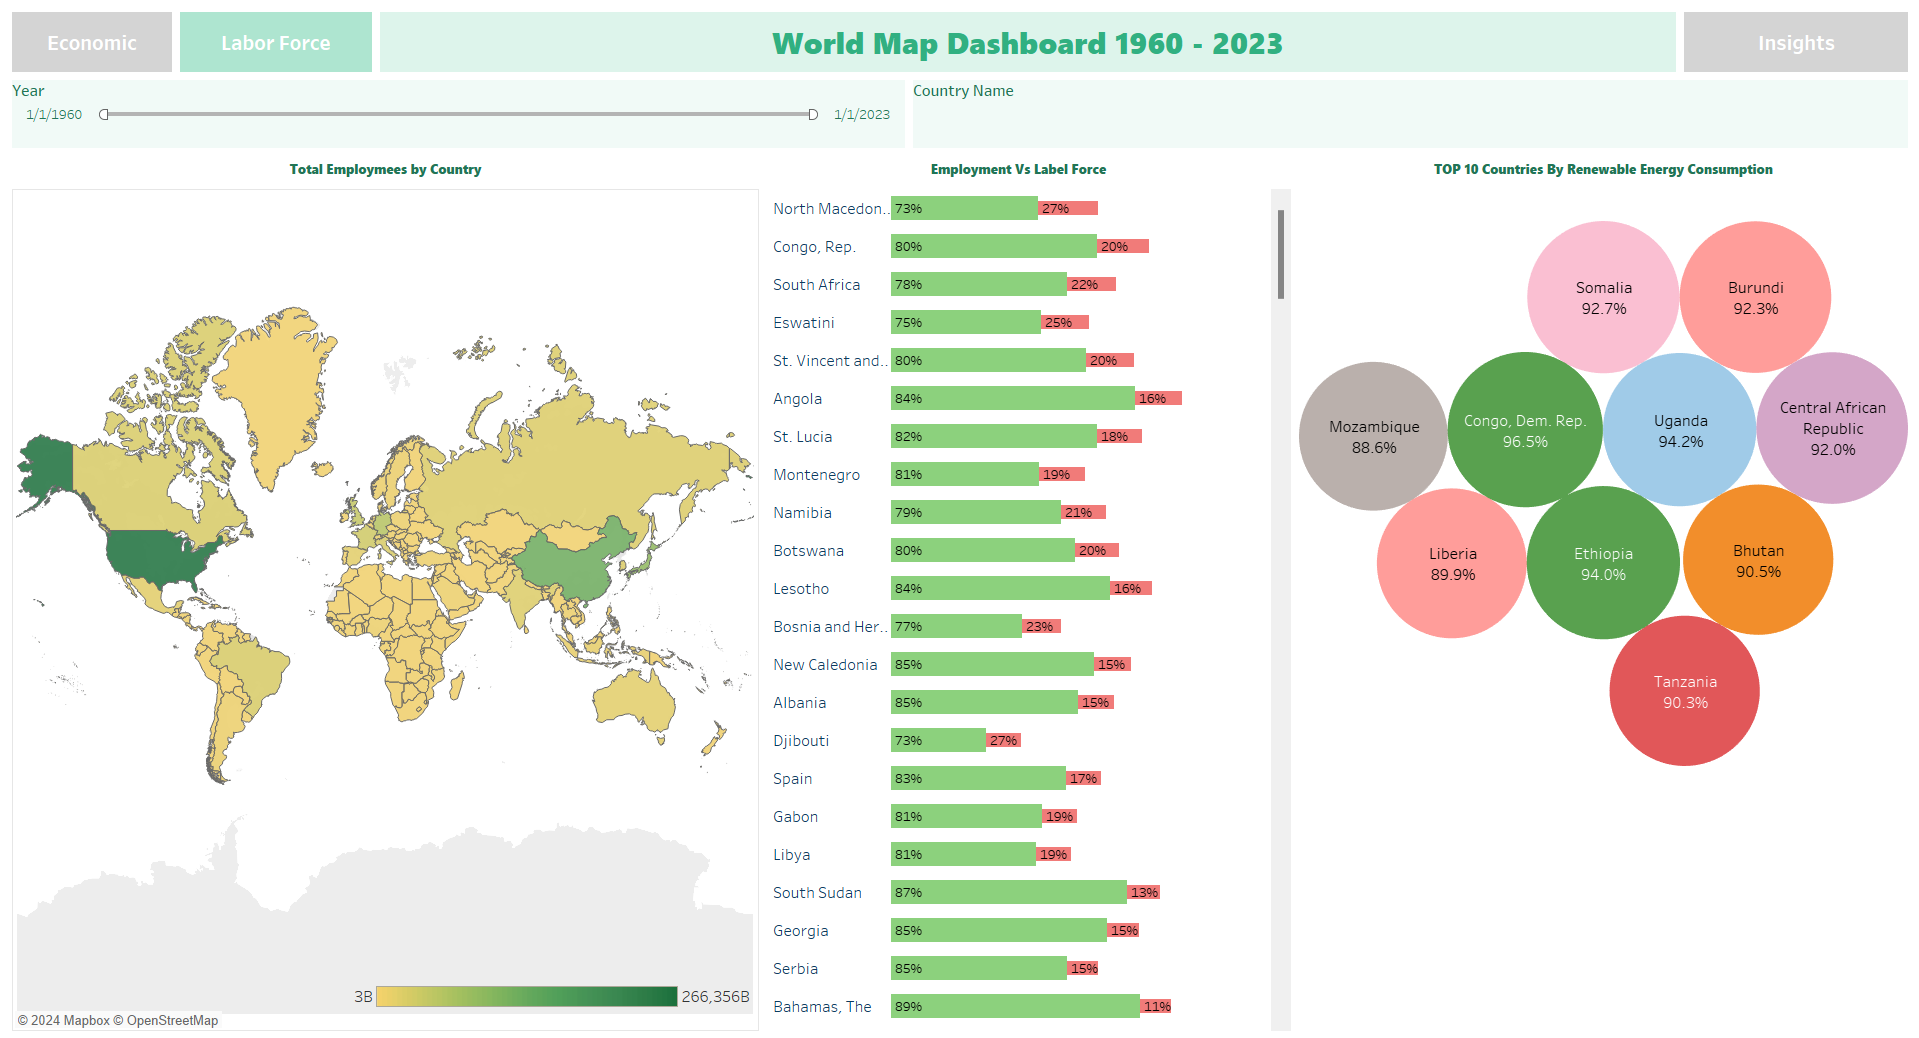
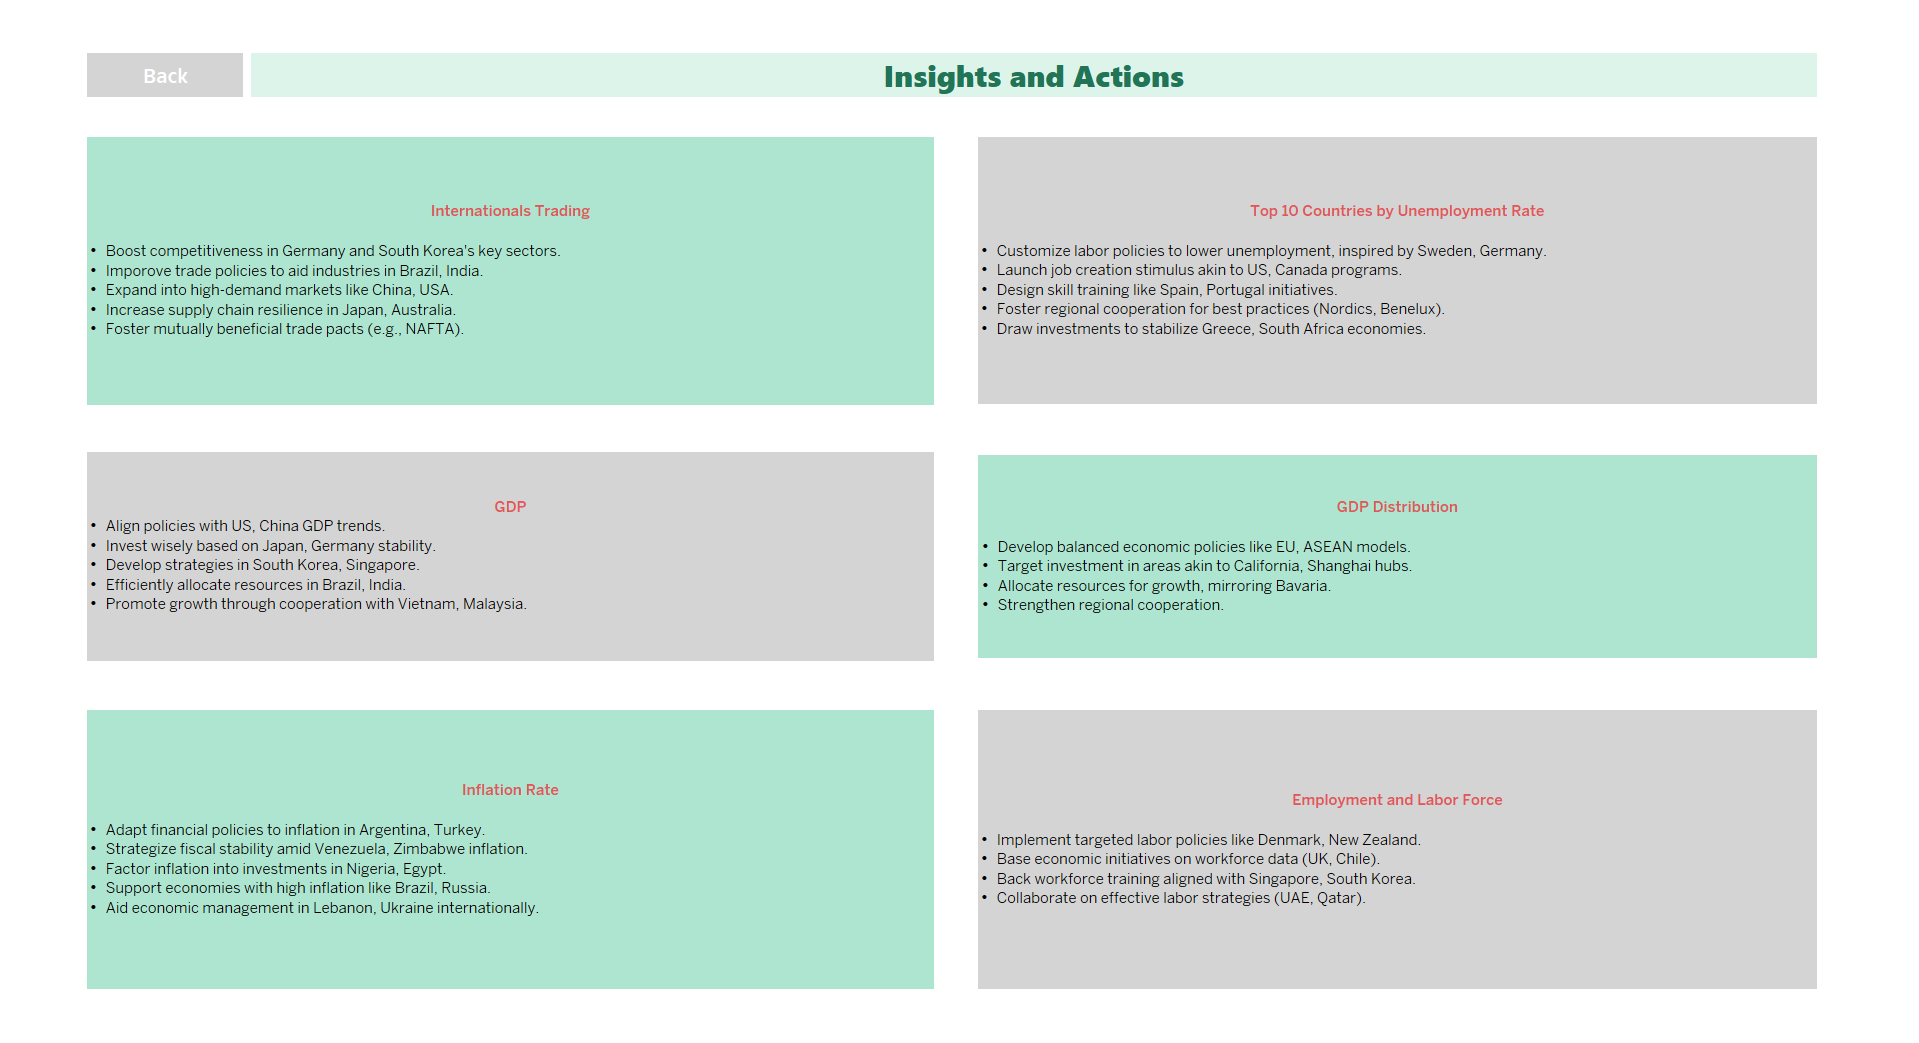
World Development Indicators Dashboard
Tableau
This dashboard provides a comprehensive overview of global economic indicators and country-specific metrics:
1- Global GDP Overview and Growth Trends
2- Comparison of Exports versus Imports across nations
3- Analysis of top countries ranked by Inflation and Unemployment rates
4- Historical trends of GDP among leading economies over time
5-Insights into Renewable Energy Consumption and Employment statistics across various countries.
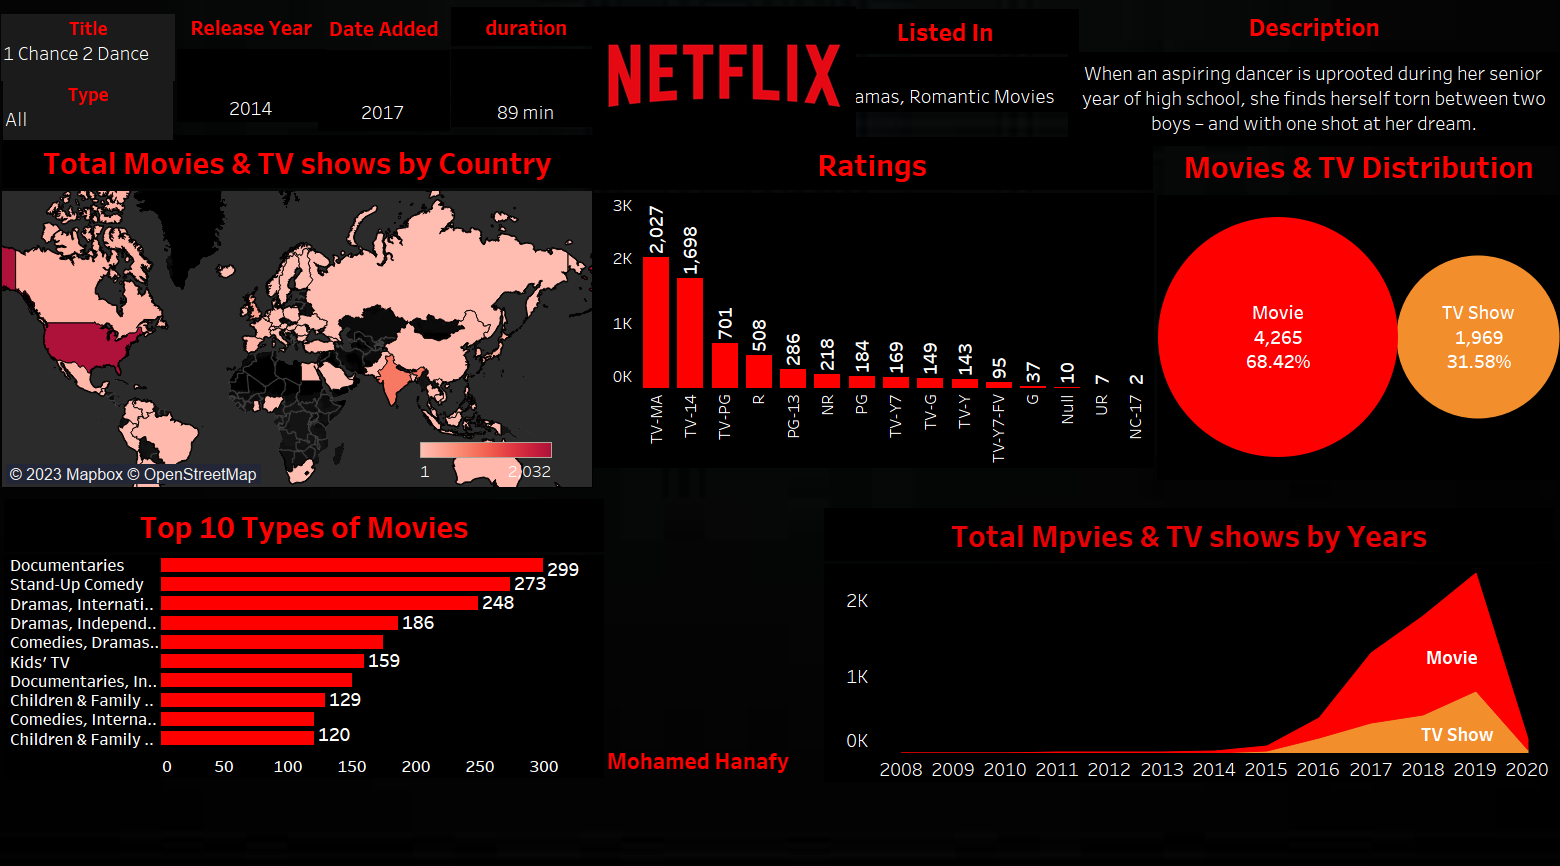
Netflix Analysis
Tableau
This dashboard is a powerful tool designed to provide comprehensive insights into Netflix's content library. It enables users to analyze and understand the distribution of movies and TV shows by country, ratings, movie genres, and release years. The dashboard offers a clear visualization of key metrics, allowing content managers and decision-makers to make data-driven decisions regarding content acquisition, licensing, and audience targeting.
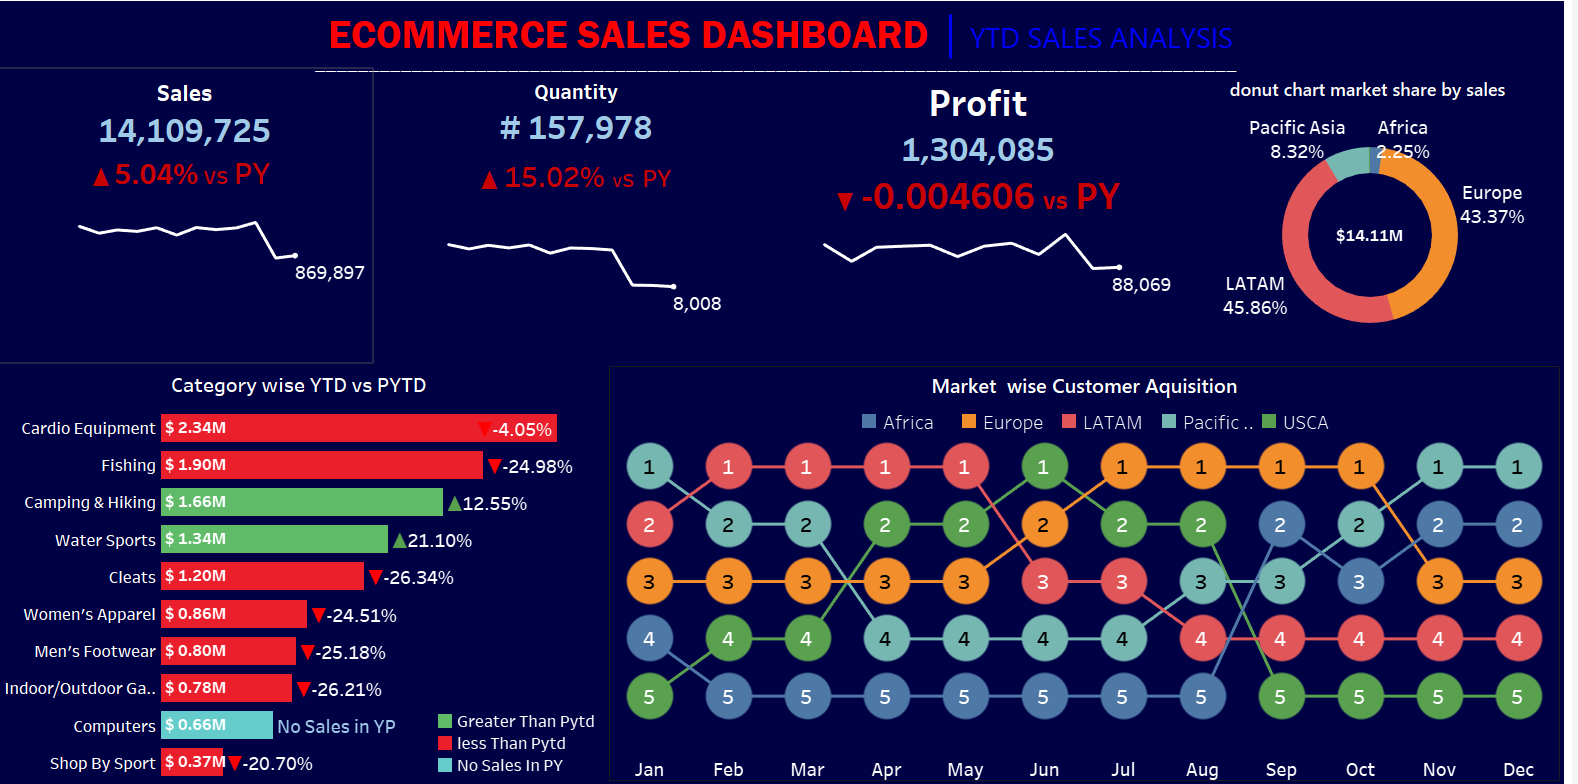
E-commerce Sales Analysis
Tableau
This dashboard provides e-commerce businesses with actionable insights into their sales performance, quantity sold, profitability, and market share. By utilizing KPIs and interactive charts, stakeholders can make data-driven decisions to optimize their inventory, marketing strategies, and customer acquisition efforts. The dashboard facilitates a deeper understanding of category-level trends, year-to-date changes, and market-wise customer acquisition, enabling businesses to stay competitive and drive growth in the dynamic e-commerce landscape.
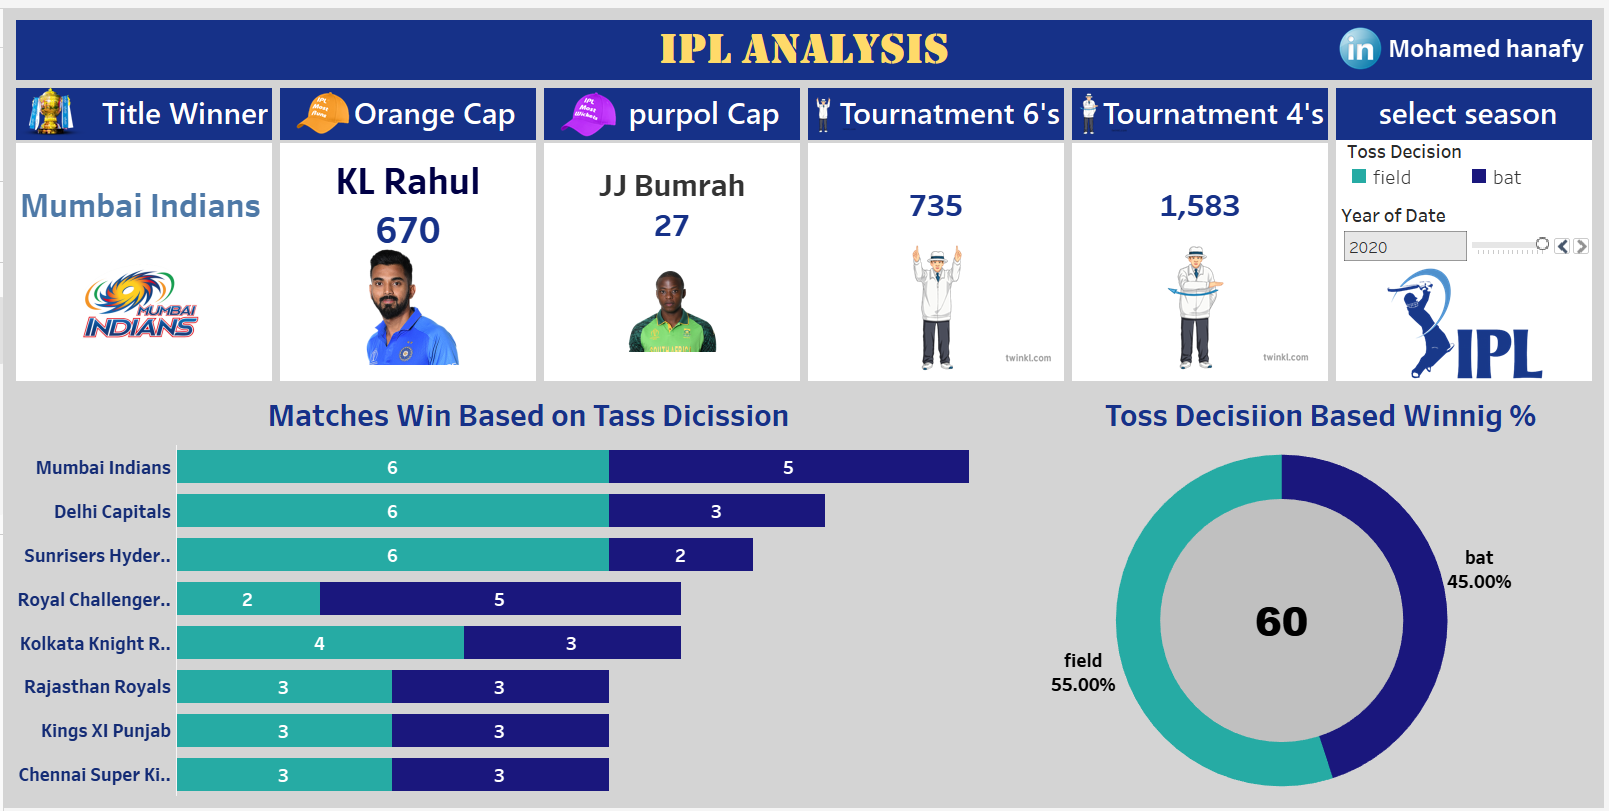
Indian Premier League Analysis
Tableau
The IPL Champion Analysis Dashboard is a comprehensive tool that provides valuable insights into the Indian Premier League (IPL) cricket tournament. It allows users to analyze and understand the performance of IPL teams, their championship victories, and player statistics. The dashboard enables fans, analysts, and team management to make data-driven decisions and gain a deeper understanding of the tournament dynamics.
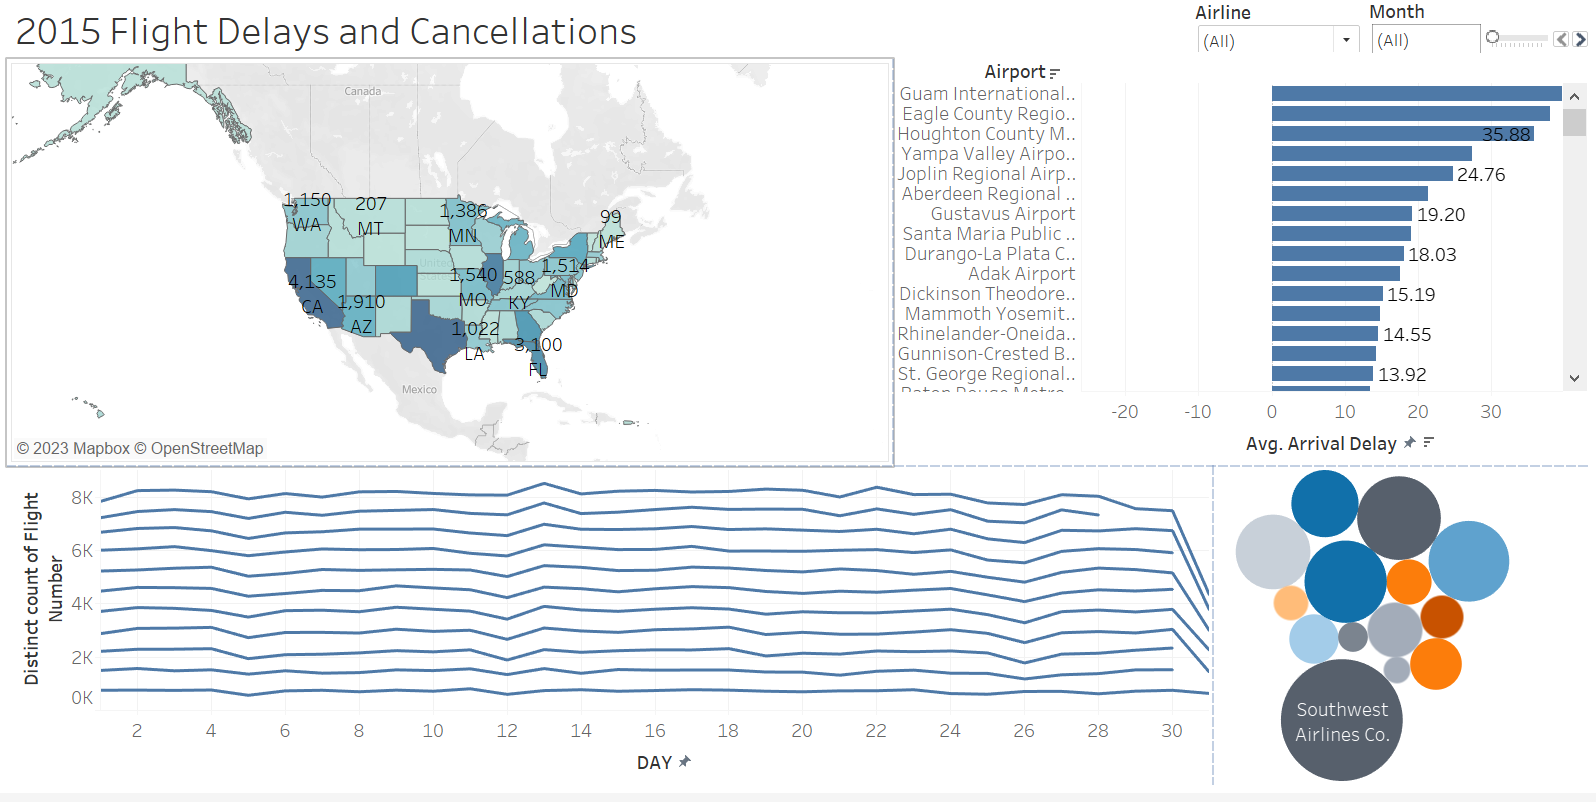
Flight Delays and Cancellations Analysis
Tableau
This Dashboard provides comprehensive insights into flight data, including delayed arrivals, on-time arrivals, airline performance, flight patterns throughout the year,
busiest and slowest days, and the city with the highest number of flights. The dashboard allows users to filter and analyze data based on various time frames,
such as months and days, to uncover trends and patterns in flight operations.
< Excel
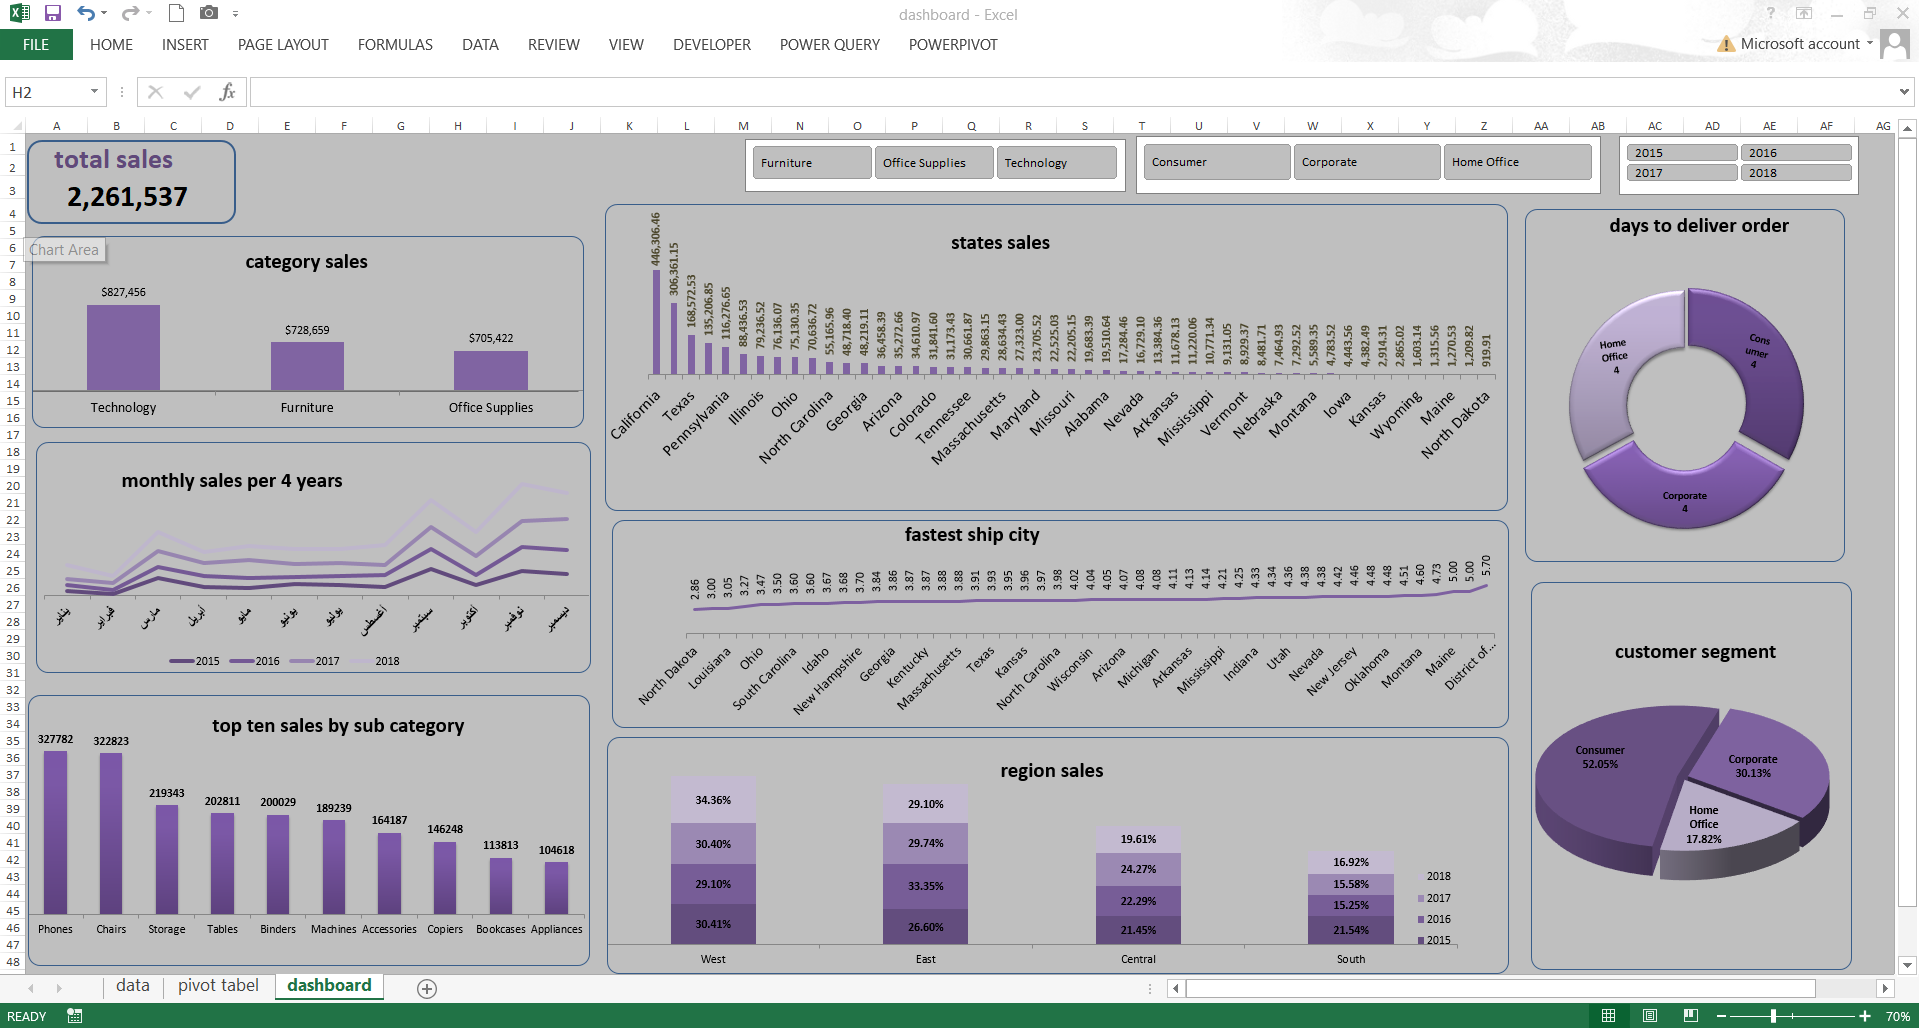
Sales Analysis
Excel Data Visualization & Insights
This Excel dashboard facilitates store sales analysis by cleaning and visualizing data. It presents total sales by category and segment, average shipping days by segment and region, sales details for 12 months across four years, top ten sub-categories, fastest shipping city, and sales distribution by states. Owned by the store sales team, it empowers data-driven decision-making, enabling the identification of trends and areas for improvement to optimize overall performance.
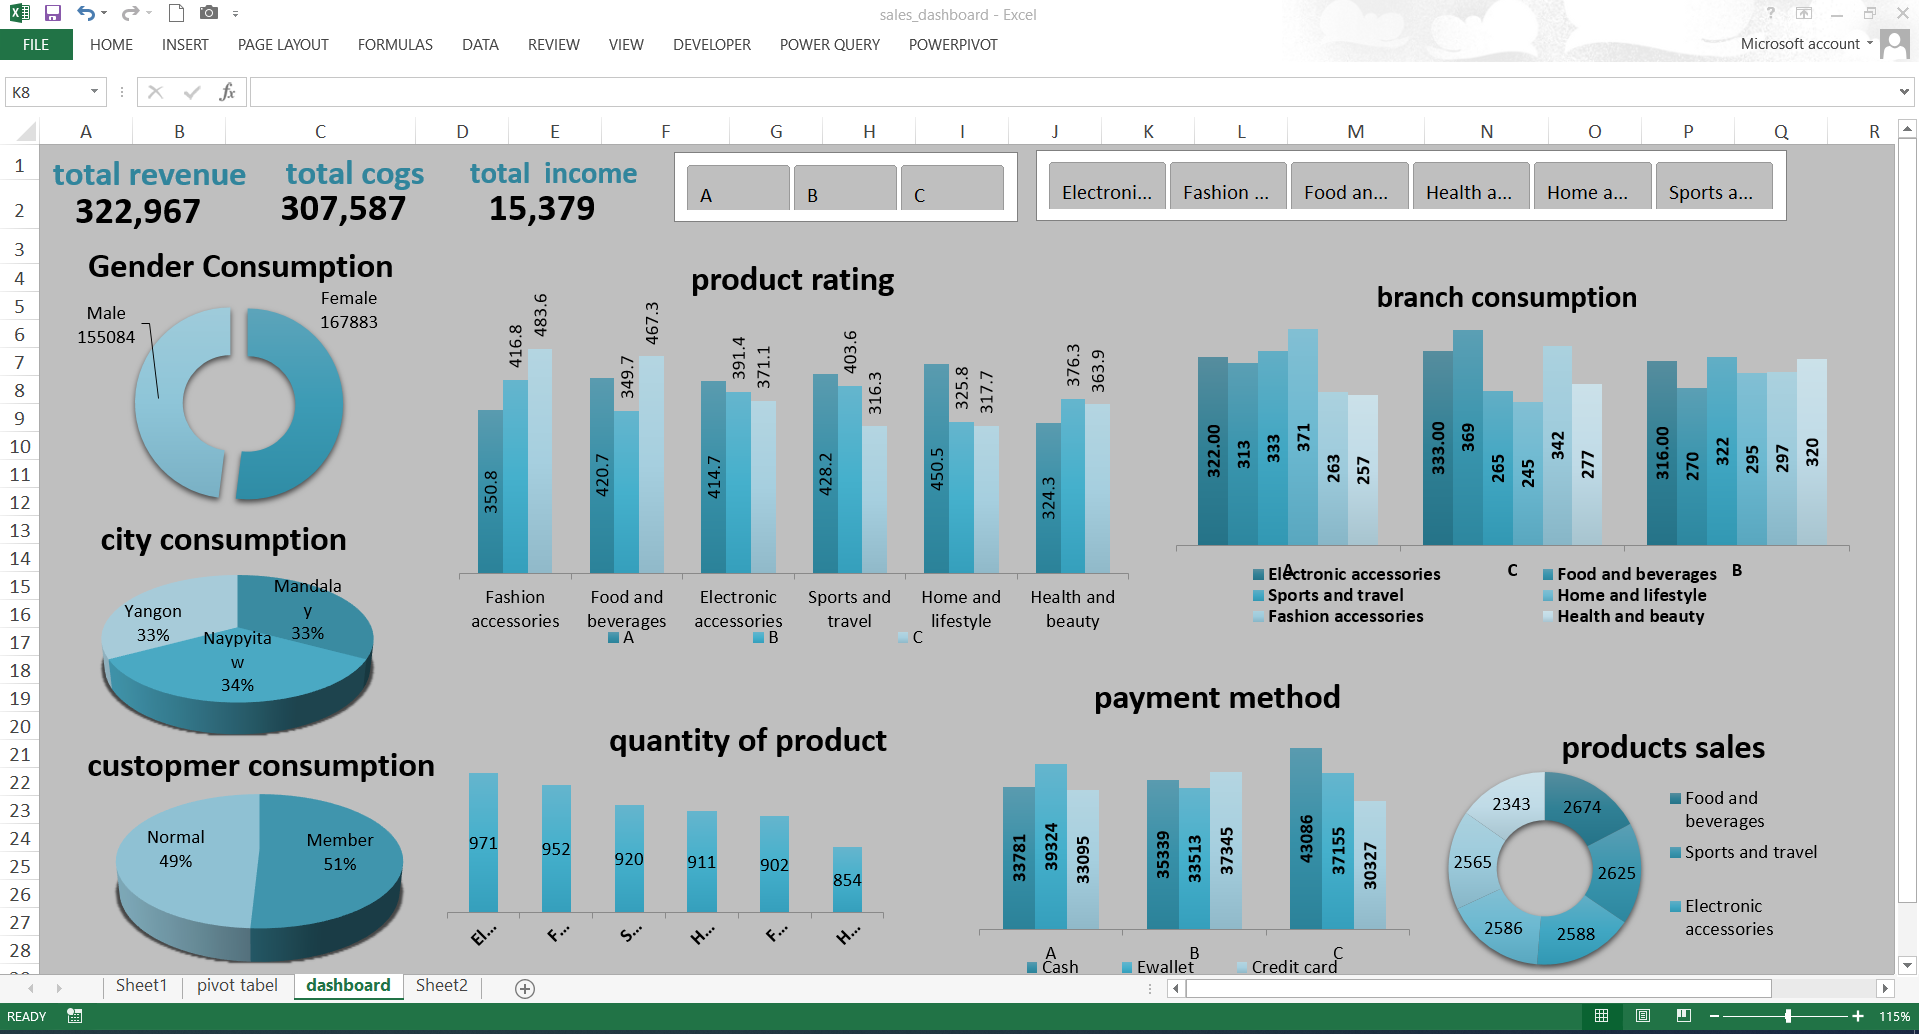
Supermarket sales Analysis
Excel Data Visualization & Insights
This Excel project analyzes data from a three-branch supermarket in Mandalay, Naypyitaw, and Yangon. The dynamic dashboard displays total revenues, expenses, and net income for all branches and allows users to explore revenues and expenses per branch and product using slicers. It assesses customer behavior, gender distribution, and payment method preferences for each branch. Additionally, the dashboard evaluates product ratings, consumption patterns, and identifies the top-selling branches. Owned by the supermarket, this data-driven Excel dashboard facilitates informed decision-making and strategic planning to optimize overall performance.
< Python
Nobel_Prize_Analysis
Python, pandas, and Matplotlib
This project delves into the Nobel Prize's history and legacy, examining patterns among laureates in categories such as physics, chemistry, literature, and peace. By analyzing the dataset, we gain insights into factors like nationality, gender, and recurring themes. We also explore controversies and the enduring impact of Nobel laureates on our world. This analysis offers a concise look at the Nobel Prize's significance and its role in celebrating humanity's contributions.

Predict House Prices
Python: Multivariable_Regression, Valuation_Model
In this project, we will delve into the world of 𝗕𝗼𝘀𝘁𝗼𝗻 𝗥𝗲𝗮𝗹 𝗘𝘀𝘁𝗮𝘁𝗲 𝗶𝗻 𝘁𝗵𝗲 𝟭𝟵𝟳𝟬𝘀 to provide valuable insights for a real estate development company. This company is looking to assess the value of potential residential projects before they begin, and our task is to build a model that will aid them in this process.

Handwashing_Discoveryanalysis
Python, pandas, and Matplotlib
This project highlights Dr. Ignaz Semmelweis's pioneering work in data-driven medicine during the 19th century. He revolutionized healthcare practices by addressing the high mortality rate of women in maternity wards, emphasizing the crucial role of data analysis and improved hygiene.

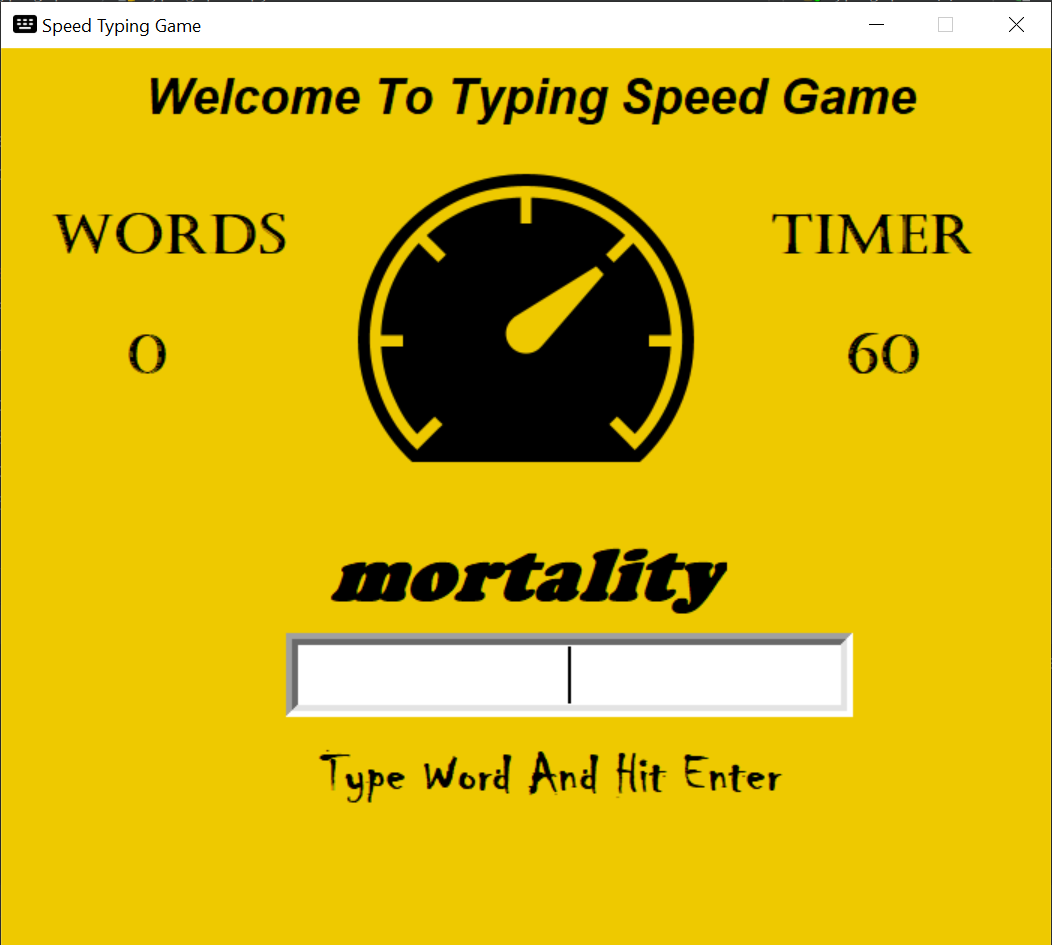
Typing Speed Test Desktop App
Python: Tkinter
It is a Python-powered desktop application that empowers users to evaluate and enhance their typing skills. With a vast library of over 10,000 words, this app calculates your words-per-minute typing speed and tracks your accuracy. Its user-friendly interface ensures a seamless experience as you discover your typing prowess, measure your progress, and work on minimizing errors.
Pong Game
Python
It is a challenging game of table tennis using the Python programming language.
The game is object-oriented, which means that it is made up of objects that interact with each other.

Dynamic Website with Bootstrap, Flask, and API Integration
Python, BootStrap, HTML, and CSS
This project involves creating a blog website using Bootstrap and Flask. The website will fetch data from APIs to display dynamic content, such as blog posts. Bootstrap will be used for responsive design and Flask for backend functionality. Integrating APIs allows for automatic updates and synchronization with the blog's backend. The blog posts will be presented in an organized and visually appealing manner using Bootstrap's components.

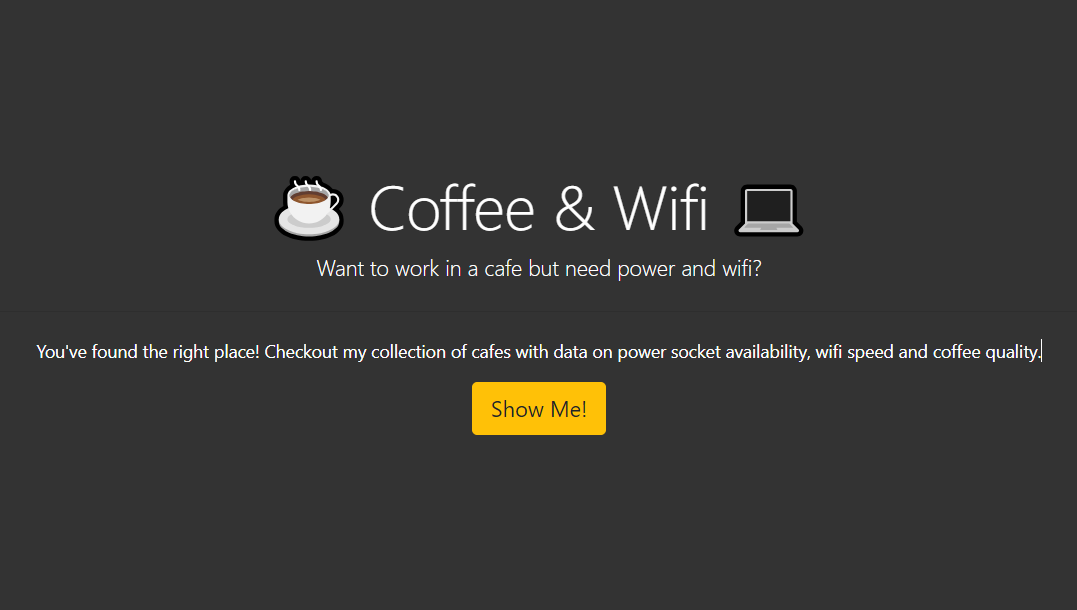
Cafe Explorer: Discover, Rate, and Share Your Favorite Cafes
Python, BootStrap, HTML, and WTForms
Developed using Flask, WTForms, HTML, and Bootstrap, this dynamic website offers a comprehensive platform for cafes and their ratings. Users can explore cafes, access ratings, and engage with the user-friendly interface. The project ensures data integrity, provides valuable information, and features a secure page for authorized users to add new cafe ratings using a CSV file for effective data management.
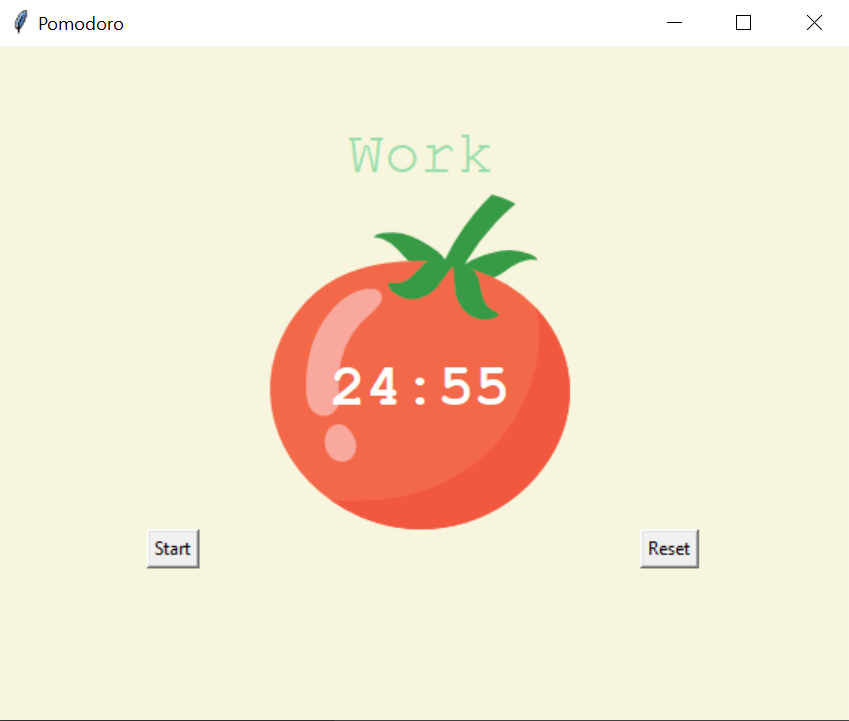
Pomodoro Technique
Python
The Pomodoro technique is a time management method that can be used to improve focus and productivity.
The technique involves working in 25-minute intervals, separated by short breaks.
This simulation of the Pomodoro technique helps users track their time and productivity.
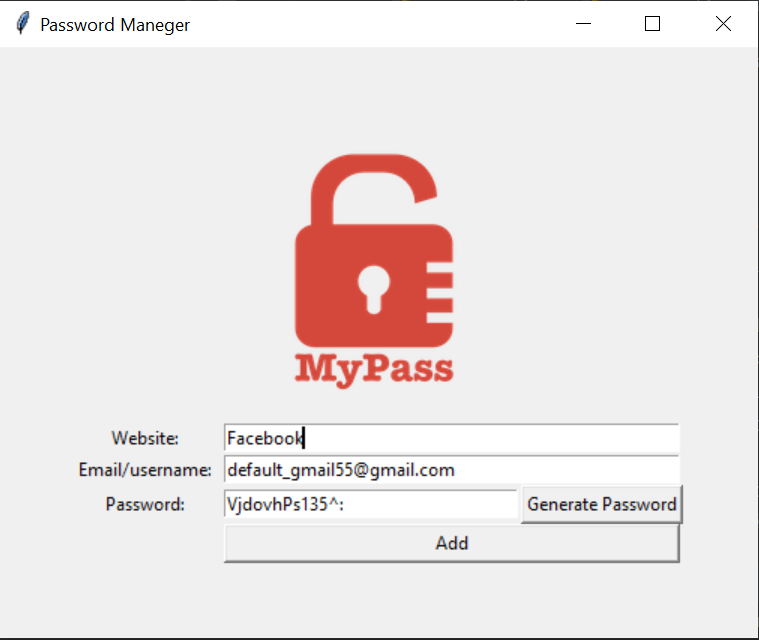
Password Generator
Python
This password generator program using Python with an appropriate GUI using the Tkinter library.
The program allows users to generate strong, random passwords that are difficult to guess. and save it to a small database file.
The program is easy to use and can be customized to meet the needs of individual users.
Snake Game
Python
This engaging script utilizes Python's functionality to create a snake game with a persistent high-score feature. The game provides an interactive and enjoyable experience where players navigate a snake on the screen, aiming to eat food and grow longer without colliding with the walls or their own tail.

Stock Reminder
Python (API) & cloud
The script is equipped with an alert mechanism that compares the current stock price to the previous day If the price changes more than 5%, it sends an instant alert to your mobile phone, ensuring you never miss important market movements.
Birthday Wisher
Python & Cloud
The script is designed to track birthdays from a CSV file and send celebratory emails to people every day automated with the cloud.
